Know Your Portfolio's Pulse, Daily
Stop waiting for monthly reports. Track occupancy, leasing, and renewals across your entire portfolio - updated every day.
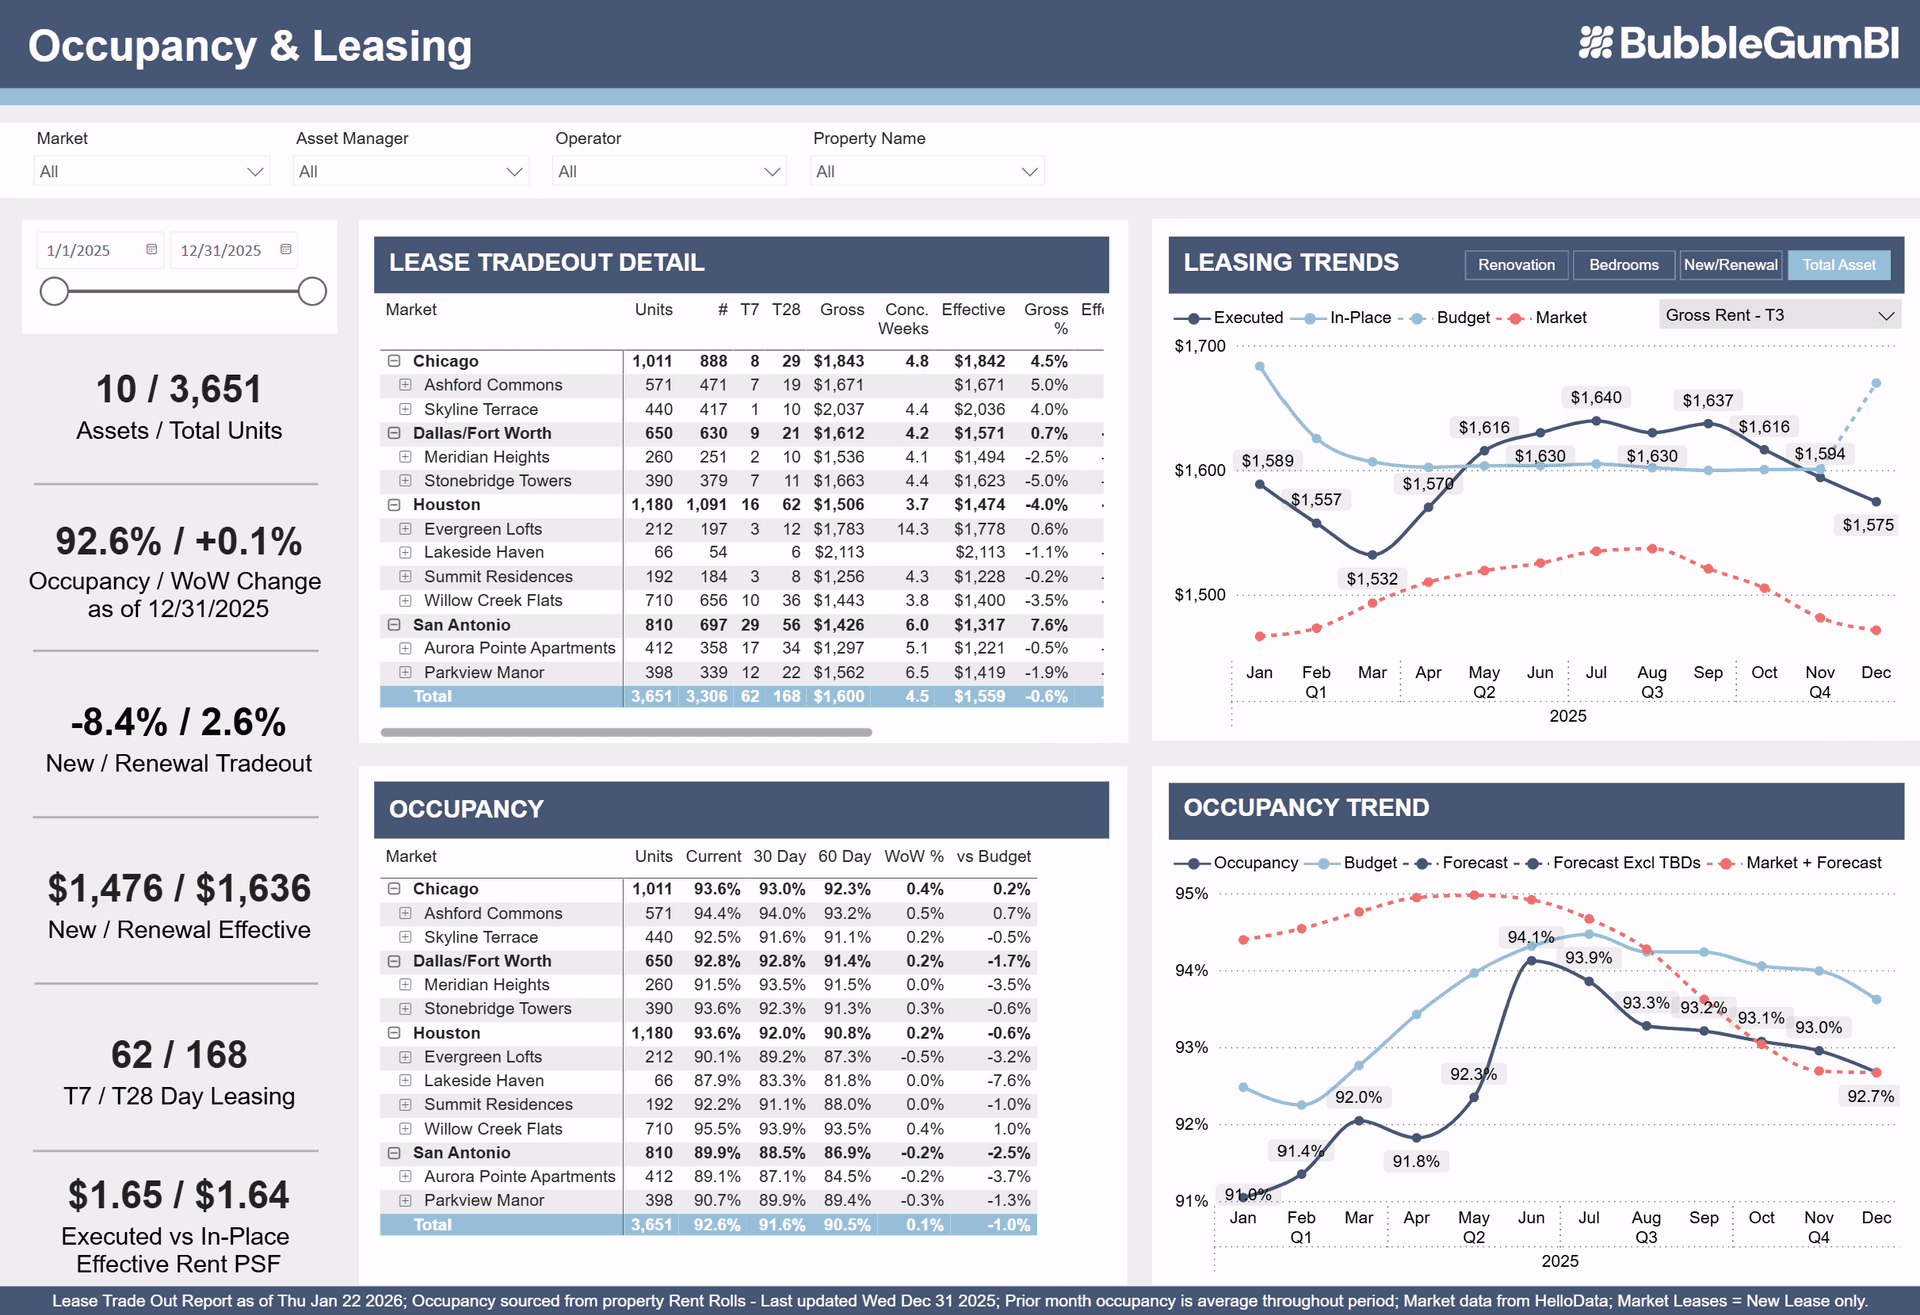
Occupancy Without Surprises
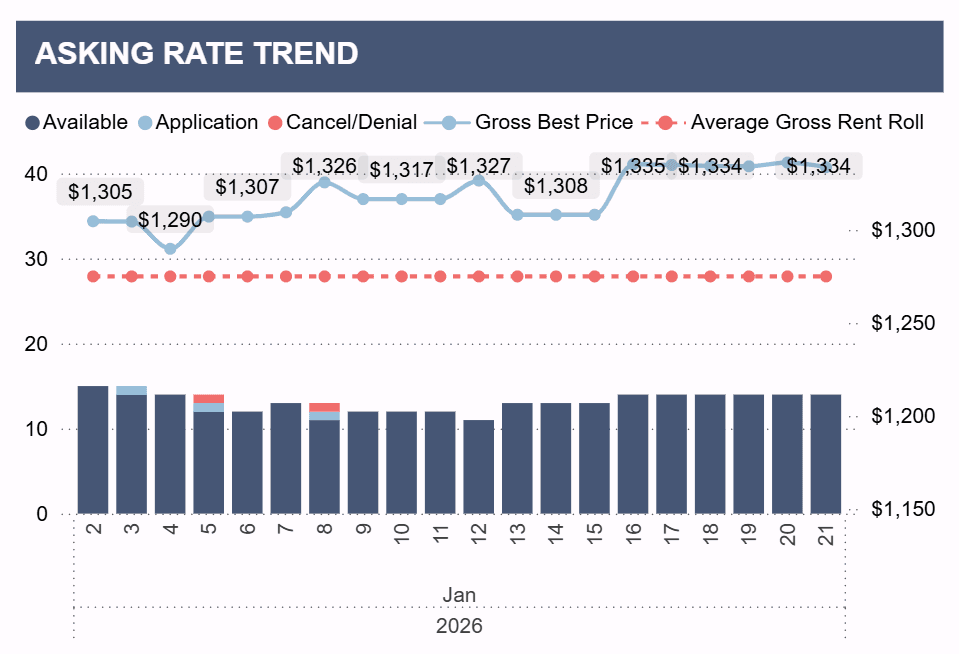
Leasing Velocity at a Glance
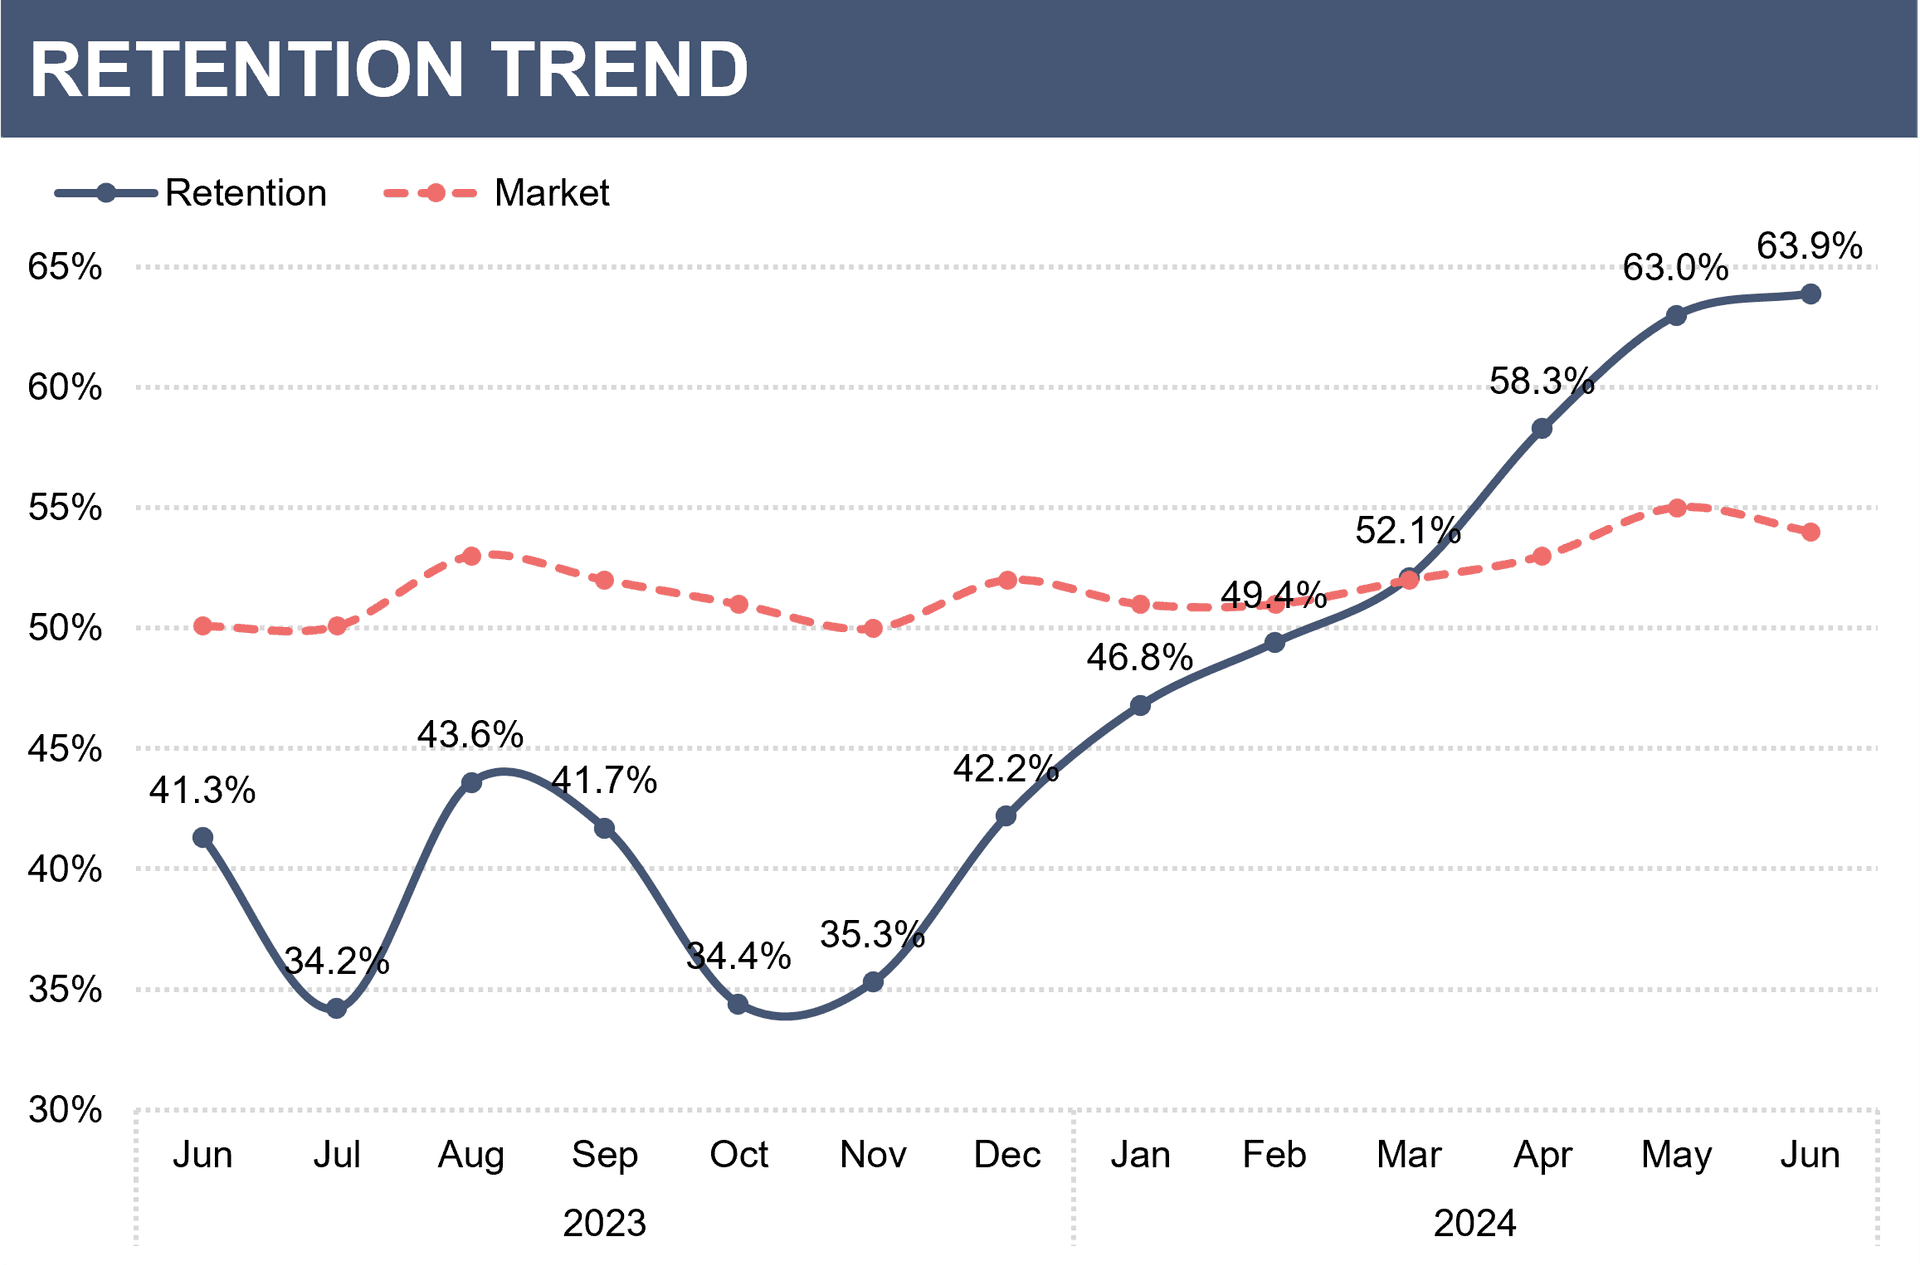
Renewals You Can Count On
Proven Results
A property improved occupancy from 90.5% to 95% in 9 months using daily occupancy tracking and demand analysis.
Read Case StudyFloorplan-level retention analysis revealed pricing disconnects, leading to 19% retention improvement over 8 months.
Read Case StudyDaily visibility into demand trends enabled proactive pricing adjustments, outperforming the submarket for 7 consecutive months.
Read Case StudyCommon Questions
Everything you need to know about getting started
We can have you live in 48 hours. Just share read-only API access and we handle everything else.
We connect directly to Yardi, Entrata, and other major property management systems. All connections are read-only with daily syncs.
Direct from your PMS plus third-party sources for public data like Google scores and market insights.
Your data refreshes every night. You wake up to live numbers, every day.
Export to Excel or CSV anytime. Enterprise clients can also connect via API to their data warehouse.
See BubbleGum BI on Your Own Assets
Book a walkthrough to see how multifamily asset managers use BubbleGum BI to understand occupancy, financials, and market position across their portfolio.
See Your Portfolio in Action