Your T12, Always in Your Back Pocket
Standardized income statements across every operator. Benchmark any line item across your portfolio in seconds, not hours.
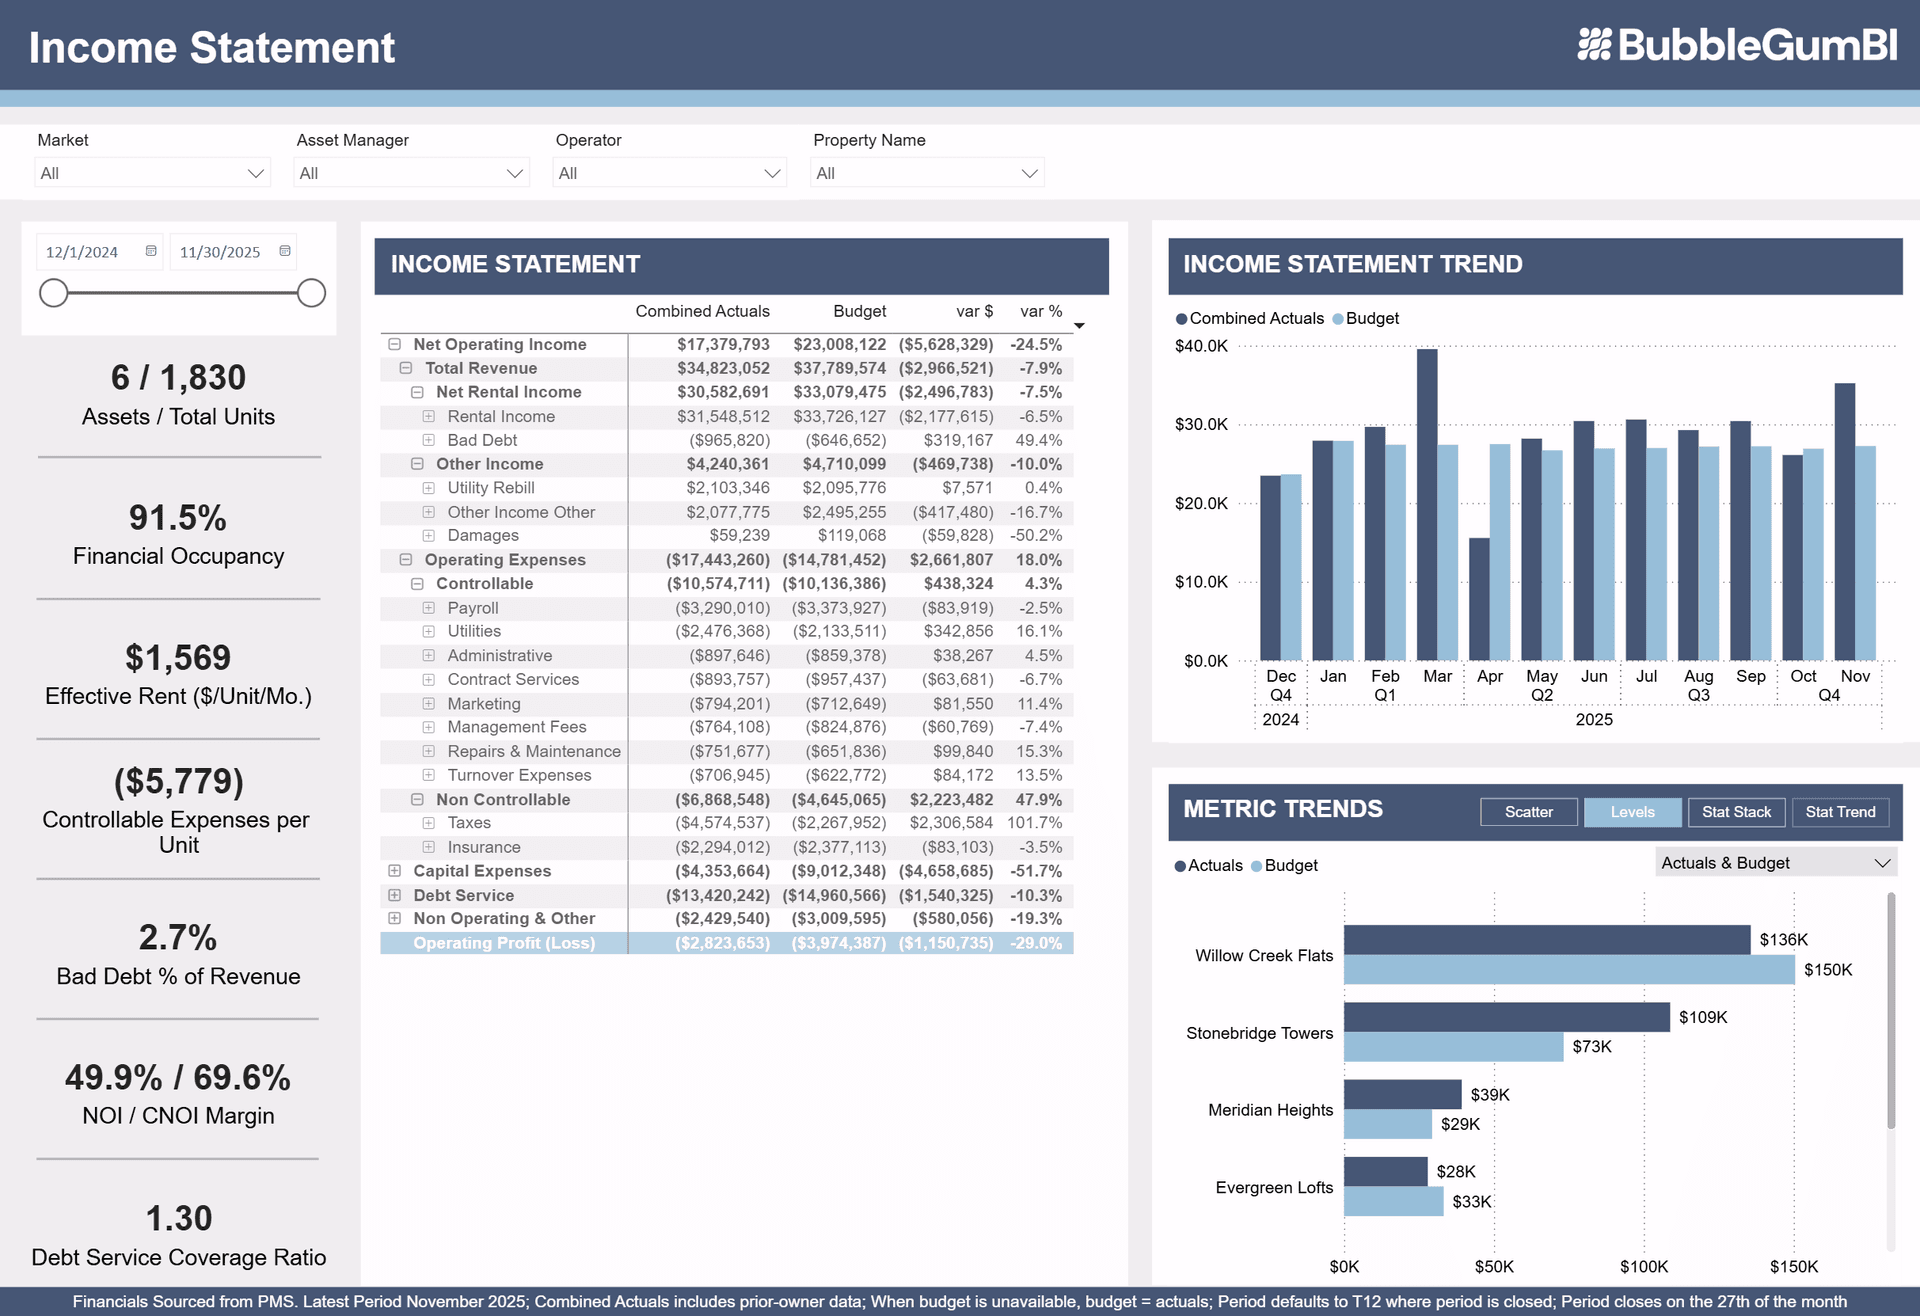
One Format, Every Property
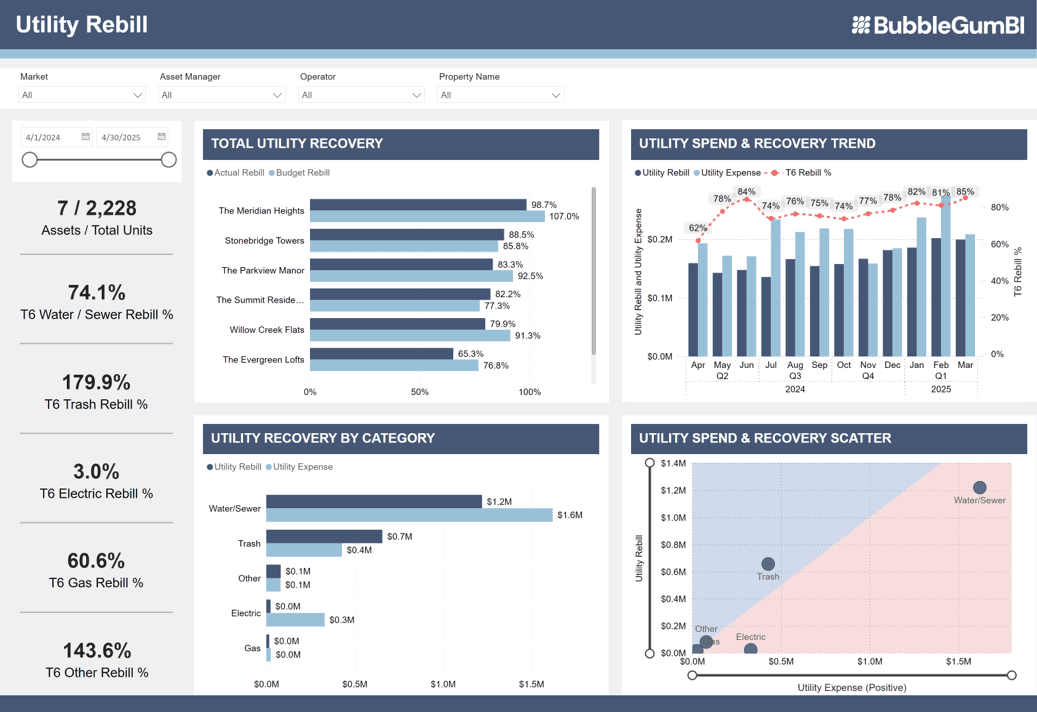
Utility Recovery Made Visible
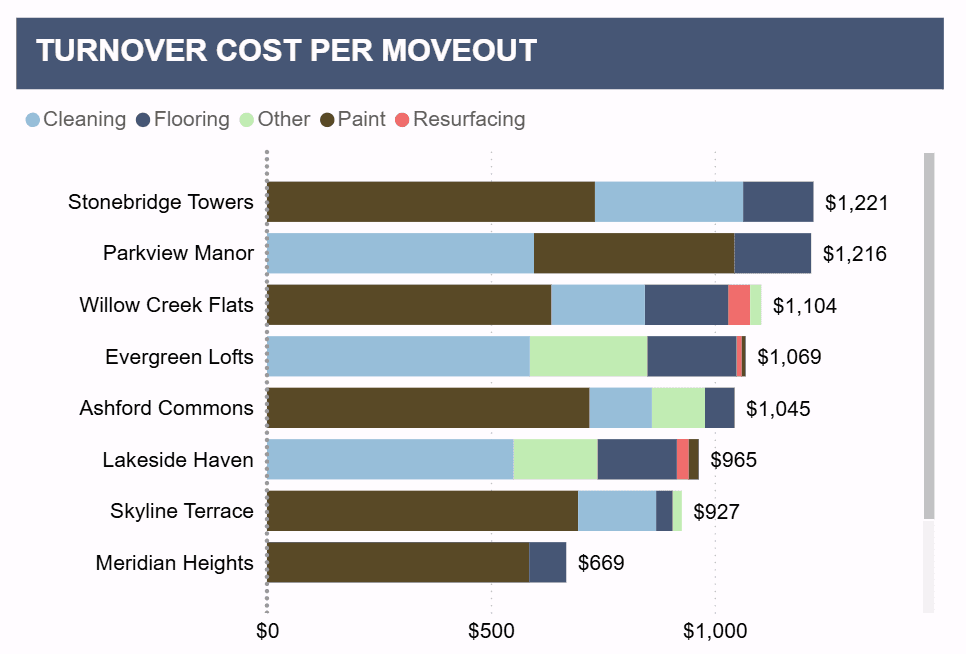
Turnover Costs That Tell a Story
Proven Results
Visibility into per-moveout costs identified operational inefficiencies, reducing turnover costs by 19.1%.
Read Case StudyTracking damage charges vs. actual costs improved billing practices and increased collections by 21%.
Read Case StudyCombined turnover savings and improved damage recovery added nearly 1% to Net Operating Income.
Read Case StudyCommon Questions
Everything you need to know about getting started
We can have you live in 48 hours. Just share read-only API access and we handle everything else.
We connect directly to Yardi, Entrata, and other major property management systems. All connections are read-only with daily syncs.
Direct from your PMS plus third-party sources for public data like Google scores and market insights.
Your data refreshes every night. You wake up to live numbers, every day.
Export to Excel or CSV anytime. Enterprise clients can also connect via API to their data warehouse.
See BubbleGum BI on Your Own Assets
Book a walkthrough to see how multifamily asset managers use BubbleGum BI to understand occupancy, financials, and market position across their portfolio.
See Your Portfolio in Action