
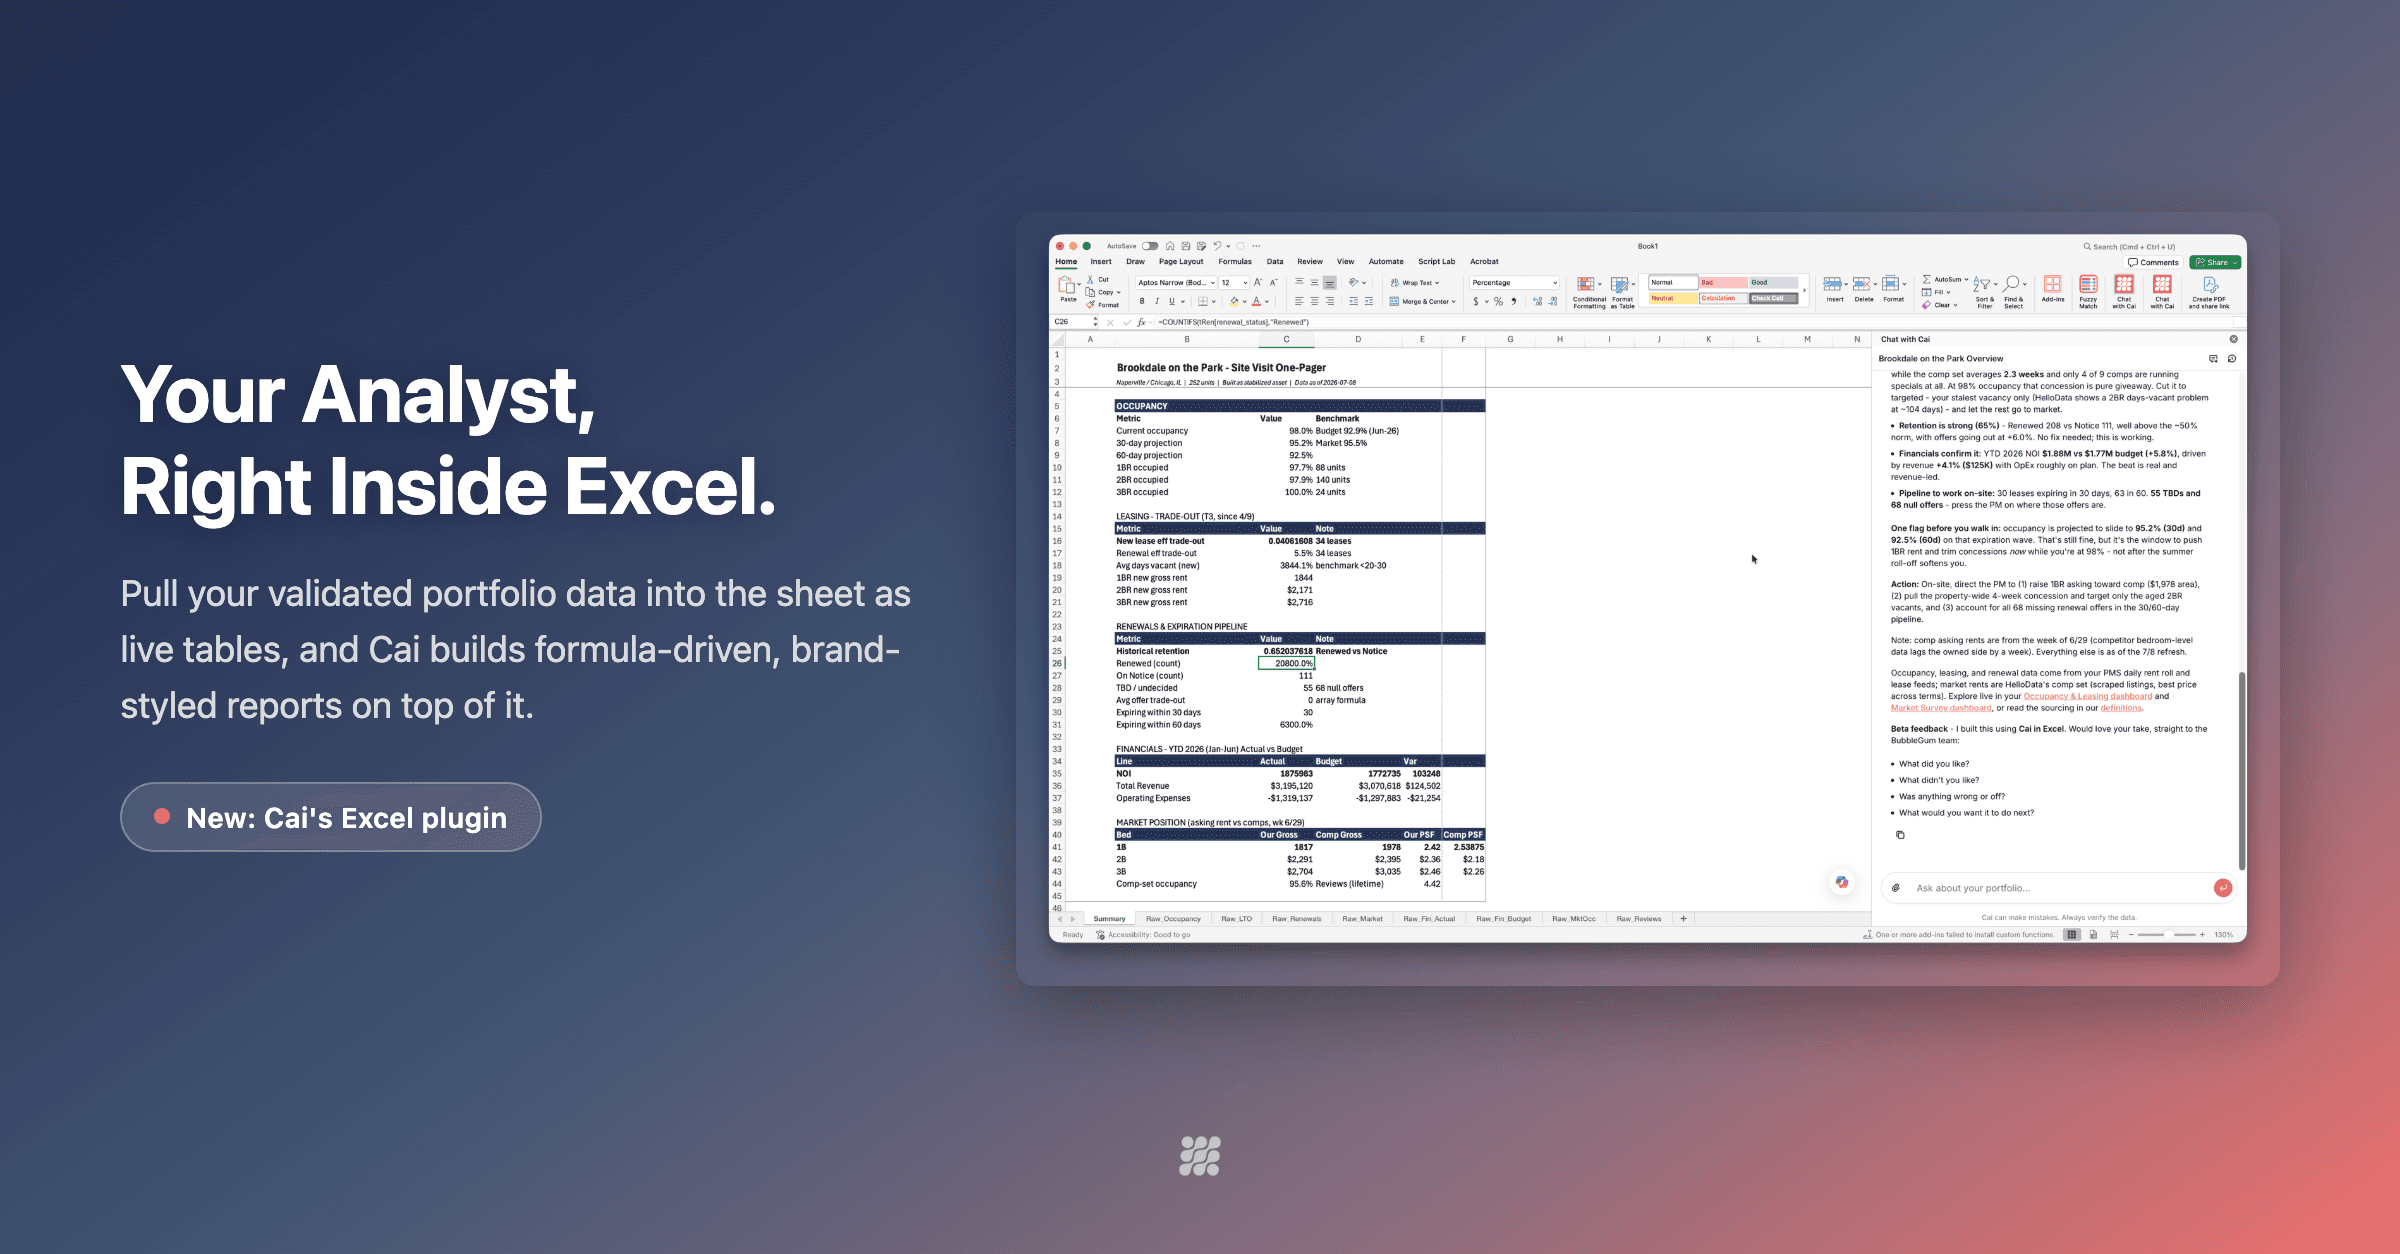
Formula-driven Excel reporting for multifamily is the practice of building owner packs, variance tables, and ops reviews as live formulas on validated portfolio data — not pasted values from last week’s PMS export.
Excel is still the operating system for most asset managers. The problem is not the grid. It is how numbers get into the grid: export, paste, reformat, hope nothing moved overnight, and pray the board deck matches the ops review.
That workflow breaks as soon as a portfolio has enough properties to matter. This post covers why hand-keyed reporting fails, what “good” looks like, and how teams use Cai inside Excel on the same warehouse data as BubbleGum BI.
Why Hand-Keyed Multifamily Excel Reports Fail
Most teams do not choose bad process on purpose. They inherit it. The PMS is the system of record for leases and GL. Excel is the system of presentation for owners, lenders, and internal leadership. Between those systems sits a human with copy-paste and a deadline.
Three failure modes show up in almost every 10+ property shop:
- Stale snapshots. Occupancy, NER, and expense lines are frozen at export time. By the IC meeting, renewals closed, concessions changed, and the sheet is already wrong.
- Untraceable figures. A pasted number has no lineage. When an owner asks “where did 93.2% come from?”, the answer is a scavenger hunt across tabs and email threads.
- Brand and format tax. Every analyst rebuilds colors, column widths, and print layouts. The last hour before a send is formatting, not analysis — the opposite of what time-savings case studies show high-performing teams protect.
Purpose-built multifamily business intelligence fixes dashboards. It does not, by itself, fix the Excel layer where decisions still get packaged. You need both.
What Formula-Driven Reporting Means in Practice
Formula-driven reporting has three non-negotiables:
- Source data lands as tables, not cells of magic numbers. Leasing, occupancy, and financial extracts should be structured tables you can filter, sort, and audit.
- Summaries reference those tables with formulas. Totals, variances, and per-unit metrics recalculate when rows refresh. Nothing critical is hard-coded.
- Every headline number can be walked back to rows. Traceability is the difference between a suggestion and a decision support artifact lenders and LPs will accept.
That is the same standard as validated computation in the app: outputs are reproducible and source-linked, not vibes with a chart.
| Workflow | Hand-keyed paste | Formula-driven live data |
|---|---|---|
| Data freshness | As of last export | Recalculates when warehouse tables refresh |
| Audit trail | “It was in the email” | Native tables + formula references |
| Multi-property scale | Linear analyst hours | Same sheet structure across the portfolio |
| Formatting | Manual every cycle | House colors and print-ready layout by default |
| Owner / lender trust | Fragile under follow-up questions | Walk any number back to rows |
How Cai in Excel Closes the Gap
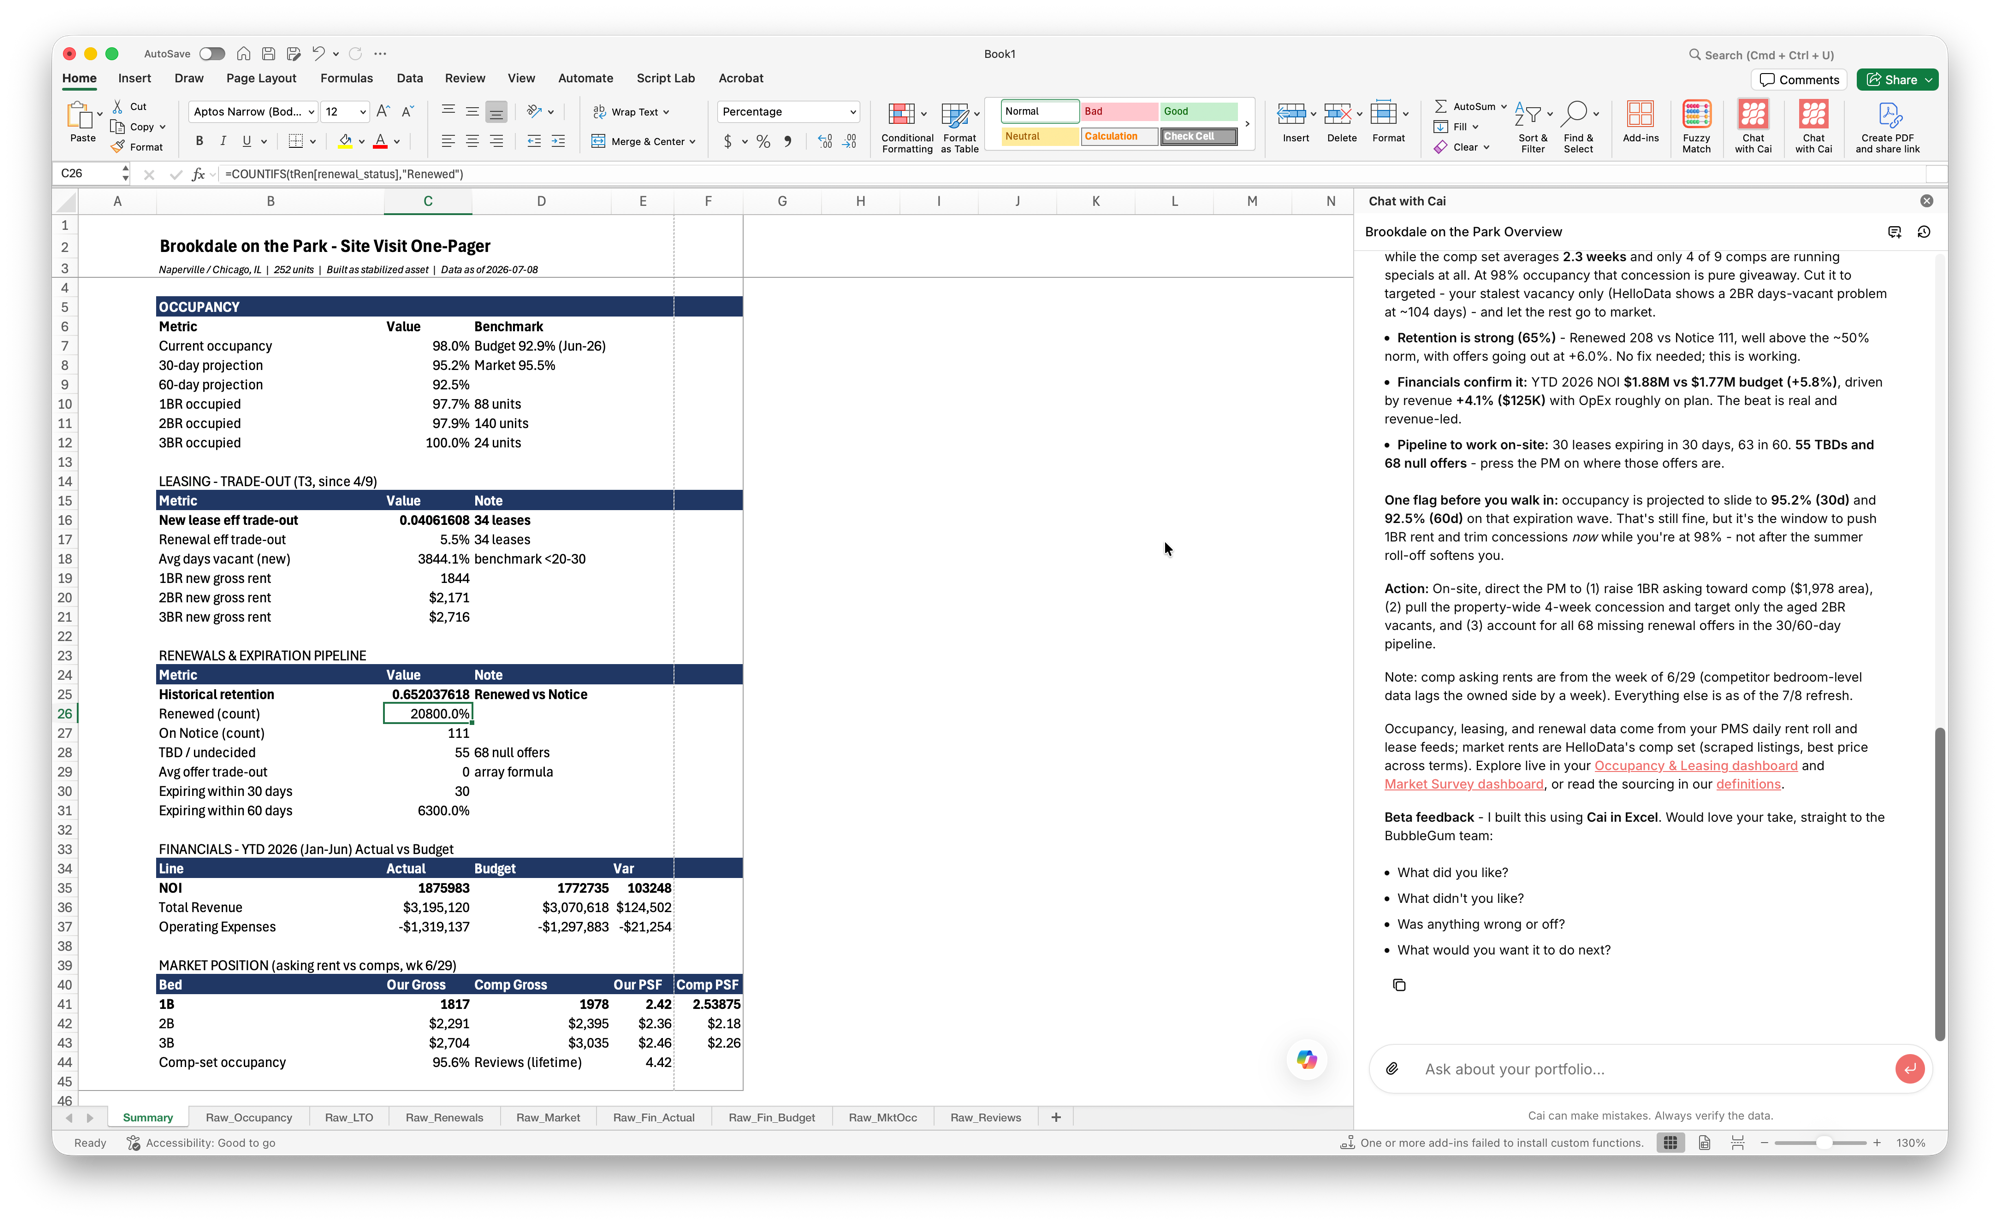
Cai in Excel is a BubbleGum add-in that puts Cai in the spreadsheet on the same validated portfolio data you use in the app. It is not a generic chatbot that invents ranges. It is built for operator work product.
- Pulls real data as Excel tables. The way Cai cites data in web chat, in Excel those citations land as native tables you can audit.
- Builds on formulas, not pasted values. Summaries and reports reference those tables so every figure recalculates when data changes.
- Uses your colors and formatting. Brand colors and house layout keep sheets clean and print-ready for owner and lender delivery.
Typical paths teams take:
- Build a new report from scratch in Excel with Cai as co-pilot
- Migrate a hand-keyed template so it runs off the BubbleGum warehouse
- Ride along in sheets the team already keeps — without abandoning Excel as the delivery format
An admin turns the add-in on for the team. Implementation stays aligned with BubbleGum’s 48-hour speed-to-value model for the broader platform: you are not standing up a separate BI project just to fix spreadsheets.
See Cai on your portfolio data
Validated computation in the app and formula-driven Excel on the same warehouse.
Schedule a DemoWhere This Fits With Dashboards and AI
Excel is not a replacement for daily-updated operations and financial dashboards. Dashboards are for monitoring. Excel remains the leave-behind and the working model for many IC and owner conversations.
The winning stack for modern operators:
- PMS as system of record (Yardi, Entrata, and more)
- Purpose-built BI for daily portfolio visibility and market intelligence
- Cai for diagnostics, scheduled analysis, and natural-language questions
- Cai in Excel for formula-driven packs that still need to live in a workbook
If you are still reconciling three exports into one owner tab every month, the bottleneck is not analyst skill. It is architecture.
A Practical Migration Path (Without Boiling the Ocean)
- Pick one painful pack. Weekly occupancy vs budget, monthly owner update, or lender covenant schedule — not every workbook on day one.
- Define the source tables. Which properties, which metrics, which date logic (MTD, T3, trailing twelve).
- Replace paste blocks with table pulls. Keep the sheet layout stakeholders already trust.
- Convert summaries to formulas. Kill hard-coded totals and variance lines.
- Document the audit path. Anyone on the team should be able to click from a headline number to rows.
Teams that win treat this like process design, not a one-off “AI demo.” The sheet becomes a living system, not a monthly art project.
Frequently Asked Questions
What is formula-driven Excel reporting for multifamily portfolios?
Formula-driven Excel reporting means summaries, variance tables, and owner packs reference live data tables instead of pasted values. When the underlying portfolio data refreshes, formulas recalculate so every figure stays current and traceable to source rows.
Why is hand-keying asset manager reports a problem?
Hand-keying introduces version lag, formula drift, and untraceable numbers. Teams spend hours re-exporting from the PMS, pasting into templates, and reconciling mismatches — work that does not improve decision quality and fails under investor or lender scrutiny.
How does Cai in Excel use BubbleGum portfolio data?
Cai in Excel is a BubbleGum add-in that works on the same validated warehouse data as the app. It pulls real data as native Excel tables, builds reports with formulas that reference those tables, and applies house colors and formatting so sheets are print-ready.
Can you migrate an existing hand-keyed report into live Excel?
Yes. Common paths are building a report from scratch in Excel with Cai, migrating a hand-keyed template so it runs off the BubbleGum warehouse, or using Cai as a co-pilot inside sheets your team already keeps. An admin enables the add-in for the team.
How is this different from exporting CSV from a PMS?
A CSV export is a static snapshot. Formula-driven reporting keeps Excel tables tied to validated portfolio data and recalculates when data changes. Citations land as native tables you can audit, rather than disconnected values with no lineage.
Who should use Cai in Excel?
Asset managers, analysts, and operators who still deliver work product in Excel — owner packs, lender schedules, board decks, and weekly ops reviews — especially portfolios of 10 or more properties where manual consolidation does not scale.
Put Cai in the spreadsheets your team already uses
Live portfolio data. Formula-driven reports. Print-ready formatting. Built by asset managers, for asset managers.
Schedule a Demo