
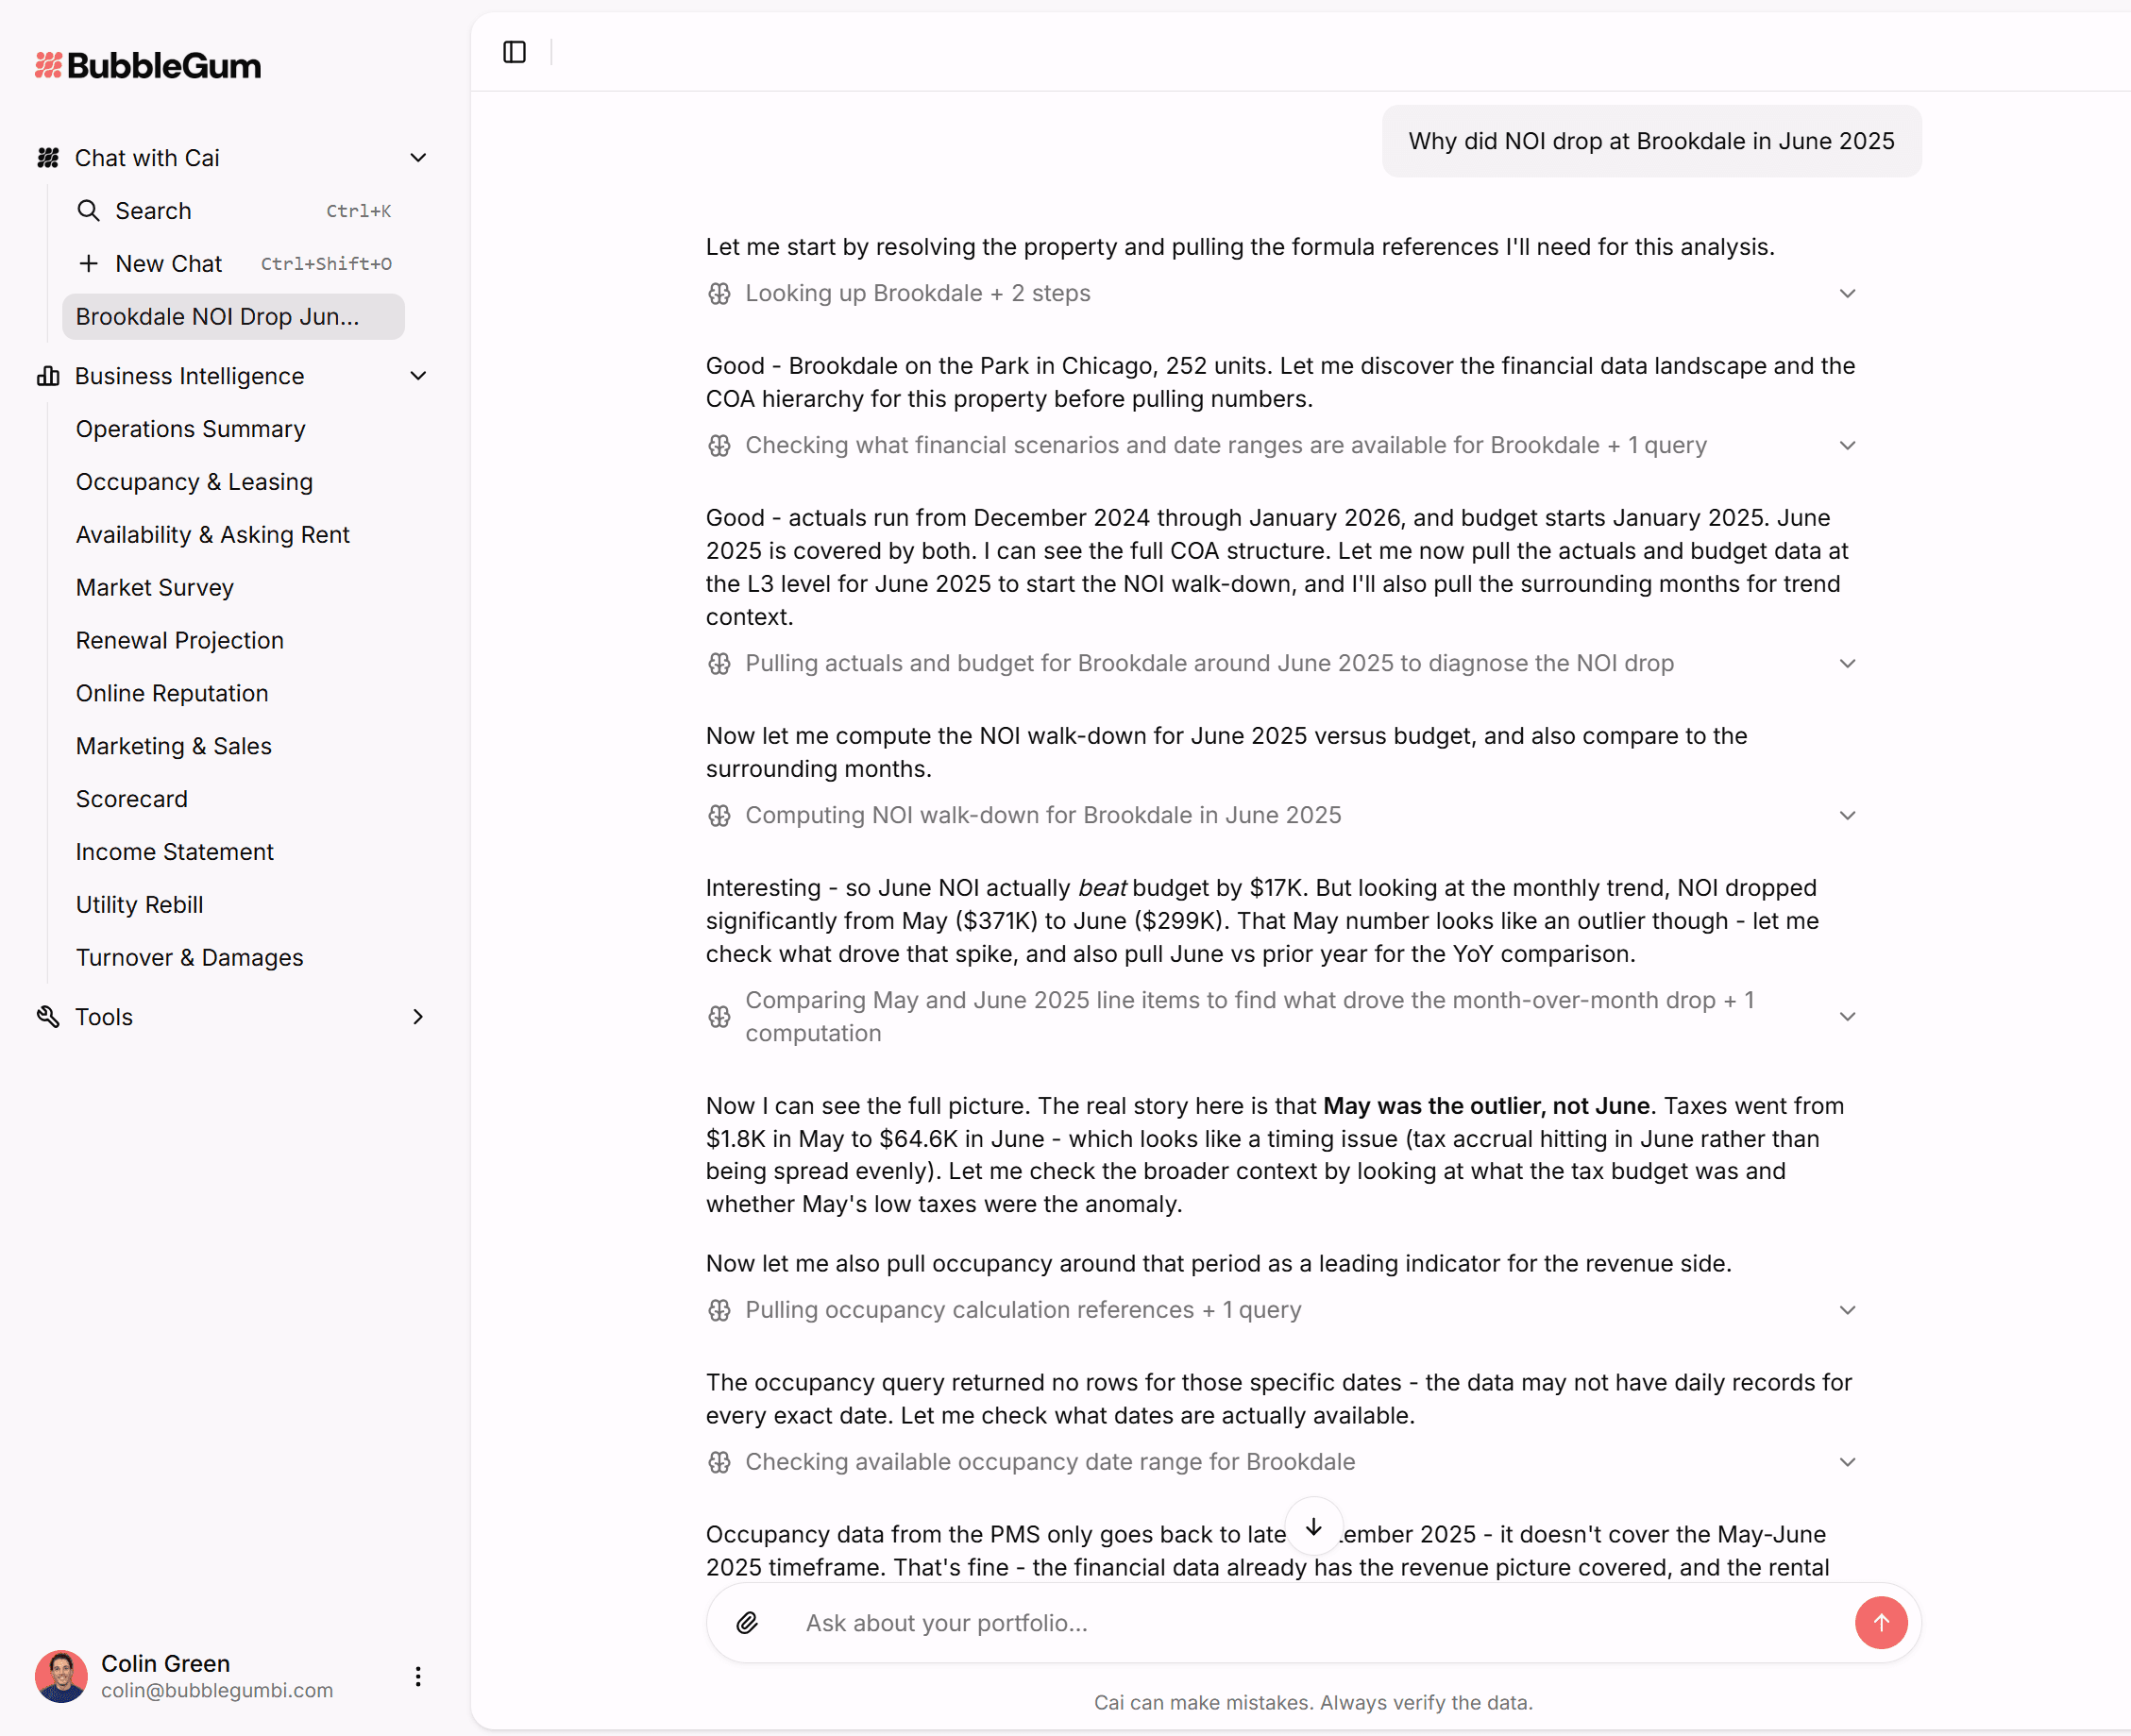
Drilling down from soft occupancy means walking from a headline rate to the actual records underneath — leasing funnel events, individual leases and renewal offers, and GL postings — so you can name the cause instead of defaulting to a rent cut.
Every portfolio has a property that “feels soft.” The dashboard shows 93.2% occupied and 1.1 points under the July budget. The meeting starts. Someone says traffic. Someone says price. Someone says the market. Nobody has the event stream open.
This playbook is for asset managers and regional managers who want a repeatable diagnostic path. It pairs with Cai’s detail-level data and the “demand before price” discipline covered in our soft-occupancy diagnosis post.
Start With the Headline — Then Refuse to Stop There
Occupancy without context is not a diagnosis. Minimum first frame:
- Physical occupancy vs budget and vs prior periods — see physical occupancy
- Economic occupancy when concessions and loss-to-lease matter — see physical vs economic
- Budget variance in plain language — “93.2% occupied, 1.1 points under the 94.3% July budget”
Daily-updated operations analytics get you that far. The next three layers separate teams that manage from teams that guess.
Layer 1: The Leasing Funnel, Event by Event
The raw CRM stream behind traffic — every tour, call, and application, plus applicant screening — is how you tell an under-toured property from an overpriced one.
| Signal | If weak… | First levers (not price) |
|---|---|---|
| Tours / calls | Demand or awareness problem | Marketing mix, response time, listing quality |
| Tour → application | On-site conversion problem | Tour path, agent coaching, unit readiness |
| Application → approval | Screening or qualification mix | Criteria consistency, lead quality |
| Approval → lease | Closing friction | Follow-up SLA, move-in timing, fee clarity |
Track velocity metrics with the same rigor as occupancy — start with leasing velocity metrics and the performance metrics guide.
Layer 2: Leases and Pricing, Line by Line
When the funnel is healthy but occupancy still lags, open the leases:
- Individual leases with full charge breakdowns
- Availability and pricing by lease term
- Every renewal offer sent — including messy states (early move-outs, held offers, month-to-month lapses, transfers)
Renewal execution is often the silent occupancy killer. A property can look “soft on new lease” when the real hole is renewal conversion. Pair with retention improvement patterns and net effective rent discipline before you slash asking rent.
Layer 3: The GL Behind the P&L Line
Occupancy stories often have a financial twin: concession expense, vacancy loss, turnover costs, or marketing spend. The individual general-ledger postings that make up a monthly category show what drove it — not just that “concessions are high.”
Detail-level GL is especially powerful when you benchmark expenses and need dollar drivers, not only ratios. See expense benchmarking and financial analytics.
Note: GL-level depth may be loaded for a subset of portfolios depending on data readiness. The diagnostic habit still applies: never stop at the category total if you can see postings.
Ask Cai to go deeper on any headline metric
From occupancy to events, leases, and GL — with validated computation and traceable sources.
Schedule a DemoHow Cai Uses Detail-Level Data
BubbleGum’s detail-level data lets Cai drop into the records underneath a headline metric: the leasing funnel event stream, line-by-line leases and pricing, and GL postings where available. Cai reaches for this on its own when a number needs explaining — and you can always ask for the records behind any figure.
That is validated computation in practice: proprietary diagnostic framework, operator-credible reasoning, full data traceability. No black-box “trust me” occupancy story for the board.
A 30-Minute Soft Occupancy Drill (Use This Week)
- Minutes 0–5: Occupancy vs budget, vs last 30/90 days, vs peer properties in the same submarket.
- Minutes 5–15: Funnel volumes and conversion. Identify the first broken step.
- Minutes 15–25: Open leases and renewal offers for the units that matter this month.
- Minutes 25–30: If the story is financial, open the GL category drivers (concessions, marketing, turnover).
- Exit with one primary cause and one lever. If your only lever is “cut rent,” you did not finish the drill.
For forecasting and prevention, pair this diagnostic with occupancy forecasting and occupancy improvement case results.
Frequently Asked Questions
What does it mean to drill down from occupancy?
Drilling down from occupancy means moving from a headline rate to the underlying records — tours, applications, screening, leases, renewal offers, and GL postings — so you can explain what drove the number instead of guessing at pricing or marketing.
Why is soft occupancy hard to diagnose from dashboards alone?
Dashboards summarize. Soft occupancy can come from weak traffic, poor conversion, pricing, concessions, renewals, or make-ready delays. Without event-level leasing data and line-level financials, teams often cut rent first and learn later that demand was never the problem.
What leasing funnel events should asset managers review?
Review the CRM stream behind traffic: tours, calls, applications, and applicant screening outcomes. Volume and conversion at each step separate under-toured properties from overpriced or poorly converted ones.
How do individual leases help explain occupancy?
Line-level leases show charge breakdowns, availability and pricing by lease term, and every renewal offer sent. That detail reveals whether the issue is term mix, net effective rent, renewal execution, or something else entirely.
When should you inspect the GL behind a P&L line?
Inspect GL postings when revenue or expense categories explain occupancy-related variance — concessions, vacancy loss, turnover, or marketing spend. Individual postings show what drove the monthly category, not just that it moved.
How does Cai use detail-level data?
Cai can drop from a headline metric into the records underneath — leasing events, leases, and GL postings where loaded — and reaches for that detail when a number needs explaining. You can always ask for the records behind any figure.
Stop guessing at soft occupancy
Event-level leasing, lease detail, and GL drivers — explained by Cai with full traceability.
Schedule a Demo