
🤖 Quick Answer:
Multifamily business intelligence (BI) platforms are specialized analytics tools that integrate with property management systems to transform operational data into strategic insights. In 2026, AI integration has become table stakes—with 30-50% of proptech VC funding now flowing to AI-focused BI companies—yet only 28% of operators have deployed AI despite 45% understanding its potential. Purpose-built platforms like BubbleGum BI deliver value in 24 hours through pre-configured dashboards curated from 50+ asset managers, compared to 3-6 months for generic BI tools. Real case studies demonstrate measurable results: 4.5% occupancy gains, 19% retention improvements, 25% renovation ROI, 19% turnover cost reductions, and reputation improvements from 3.6 to 4.6 stars.
Why Multifamily Needs Purpose-Built BI in 2026
In today's competitive multifamily landscape, the gap between high-performing and average portfolios increasingly comes down to one critical factor: the speed and quality of data-driven decision-making. Traditional approaches—relying on month-end PMS reports, manual spreadsheets, and reactive management—are no longer sufficient when competitors are leveraging daily-updated analytics to optimize every aspect of portfolio performance.
Asset managers face unprecedented pressure to maximize NOI, improve retention, optimize capital allocation, and demonstrate value to investors. Yet most struggle with fragmented data sources, delayed reporting, and analytics tools that were never designed for multifamily operations. The result? Missed pricing opportunities, suboptimal renovation decisions, and hours wasted on manual reporting that could be spent on strategic initiatives.
📊 The AI Adoption Gap Creates Opportunity:
While 45% of property professionals now understand AI's potential for their operations, only 28% have actually deployed AI in building operations. This gap represents a significant competitive advantage for early adopters who move beyond understanding to implementation. Operators leveraging AI-powered BI tools today are positioning themselves ahead of the 72% still waiting on the sidelines.
The market landscape is also consolidating rapidly. M&A activity in 2025—including REBA's acquisition of Markerr for enhanced market intelligence—signals that data-driven decision-making is becoming table stakes, not a nice-to-have. Venture capital tells the same story: 30-50% of proptech VC funding now flows to AI-focused BI companies, up from approximately 20% in 2024. The investment community is betting heavily that AI-integrated analytics will define the next generation of property management.
📊 Industry Reality:
According to the National Multifamily Housing Council, properties using real-time analytics for decision-making outperform those relying on monthly reporting by an average of 4.3% in annual NOI growth. The performance gap is directly attributed to faster response times, proactive issue resolution, and the ability to capitalize on market opportunities as they arise.
This is where purpose-built multifamily business intelligence transforms operations. Unlike generic BI tools that require months of custom configuration or PMS systems that provide only basic operational reports, specialized platforms deliver immediate value through pre-configured analytics designed specifically for asset managers and directors of operations.
What Is Multifamily Business Intelligence?
📖 Definition:
Multifamily Business Intelligence (BI) is a specialized analytics platform that integrates with property management systems (Yardi, RealPage, and Entrata) to transform operational and financial data into actionable insights. Purpose-built multifamily BI provides pre-configured dashboards for occupancy optimization, financial performance tracking, retention strategies, renovation ROI analysis, and competitive market intelligence—all designed specifically for asset managers and directors of operations.
Unlike generic business intelligence tools (Tableau, Power BI, Looker) that require extensive customization, or basic PMS reporting that focuses on operations rather than strategy, purpose-built multifamily BI platforms offer:
- Pre-configured dashboards curated from industry expertise – Analytics frameworks designed by multifamily professionals who understand income-statement impact
- Direct PMS integrations – Automated daily data extraction from Yardi, RealPage, and Entrata without manual intervention
- Multifamily-specific metrics – Out-of-the-box tracking for occupancy trends, renewal projections, renovation ROI, turnover costs, and market positioning
- Rapid implementation – Value delivery in hours or days, not months of custom development
- Portfolio-level analytics – Cross-property benchmarking and performance comparison regardless of PMS platform
BubbleGum BI exemplifies this approach. Built by asset managers who experienced firsthand the limitations of generic BI tools, the platform delivers comprehensive multifamily analytics through dashboards curated from 50+ asset managers and operators, with implementation taking 24 hours once credentials are provided.
The Problem: Generic BI vs. PMS-Only Reporting vs. Purpose-Built BI
To understand why purpose-built multifamily BI has become essential, it's critical to recognize the limitations of alternative approaches:
PMS-Only Reporting: Operations-Focused, Not Strategic
Property management systems excel at handling day-to-day operations—lease management, rent collection, work order tracking. However, they were never designed to provide the strategic analytics asset managers need for portfolio optimization:
- Limited cross-property analytics and benchmarking capabilities
- No market intelligence or competitive positioning insights
- Difficult to extract and analyze historical trends
- Basic reporting that doesn't support strategic decision-making
- Data locked within individual PMS platforms when managing multiple properties
Generic BI Tools: Powerful But Resource-Intensive
Tools like Tableau, Power BI, and Looker offer incredible flexibility and power—but at a significant cost in time, expertise, and ongoing maintenance:
- 3-6 months implementation timeline – Custom configuration, data modeling, and dashboard development required
- Specialized expertise needed – Data analysts and BI developers required to build and maintain dashboards
- Ongoing maintenance burden – Dashboards break when business requirements change or data structures evolve
- No multifamily-specific metrics – Every KPI must be defined, calculated, and validated from scratch
- Significant consulting costs – Often $50,000-$200,000 for initial implementation plus ongoing support
| Capability | PMS Reporting Only | Generic BI (Tableau/Power BI) | Purpose-Built (BubbleGum BI) |
|---|---|---|---|
| Implementation Time | Included with PMS | 3-6 months custom build | 24 hours setup |
| Multifamily Dashboards | Basic operations reports | Requires custom build | Pre-configured from 50+ experts |
| Market Intelligence | ❌ Not included | Requires custom integration | ✅ Automated (15 comps via HelloData) |
| Portfolio Analytics | ⚠️ Limited | Requires data modeling | ✅ Out-of-box cross-property |
| Forecasting | ❌ Not available | Requires data science expertise | ✅ Historical trend-based |
| Time to Value | Limited value | 6-12 months | 24 hours |
Key Benefits for Multifamily Asset Managers and Directors of Operations
Purpose-built multifamily BI platforms deliver specific, measurable benefits that directly impact portfolio performance and operational efficiency:
⚡ 60-80% Reduction in Reporting Time
Daily automated data updates eliminate manual report compilation. Asset managers spend less time gathering data and more time analyzing insights and making strategic decisions.
📈 2-5% NOI Improvement
Data-driven optimization of pricing, retention, and operations typically delivers 2-5% NOI improvements within the first year through better decision-making and faster issue resolution.
🎯 Proactive vs. Reactive Management
Daily insights enable early problem identification and opportunity capture. Respond to market changes in days, not weeks or months after the fact.
🔄 Portfolio-Wide Consistency
Standardized metrics and benchmarking across all properties regardless of PMS platform or operator. Identify best practices and replicate success systematically.
Core Analytics Capabilities for Multifamily in 2026
Modern multifamily BI platforms must provide comprehensive analytics across five critical areas:
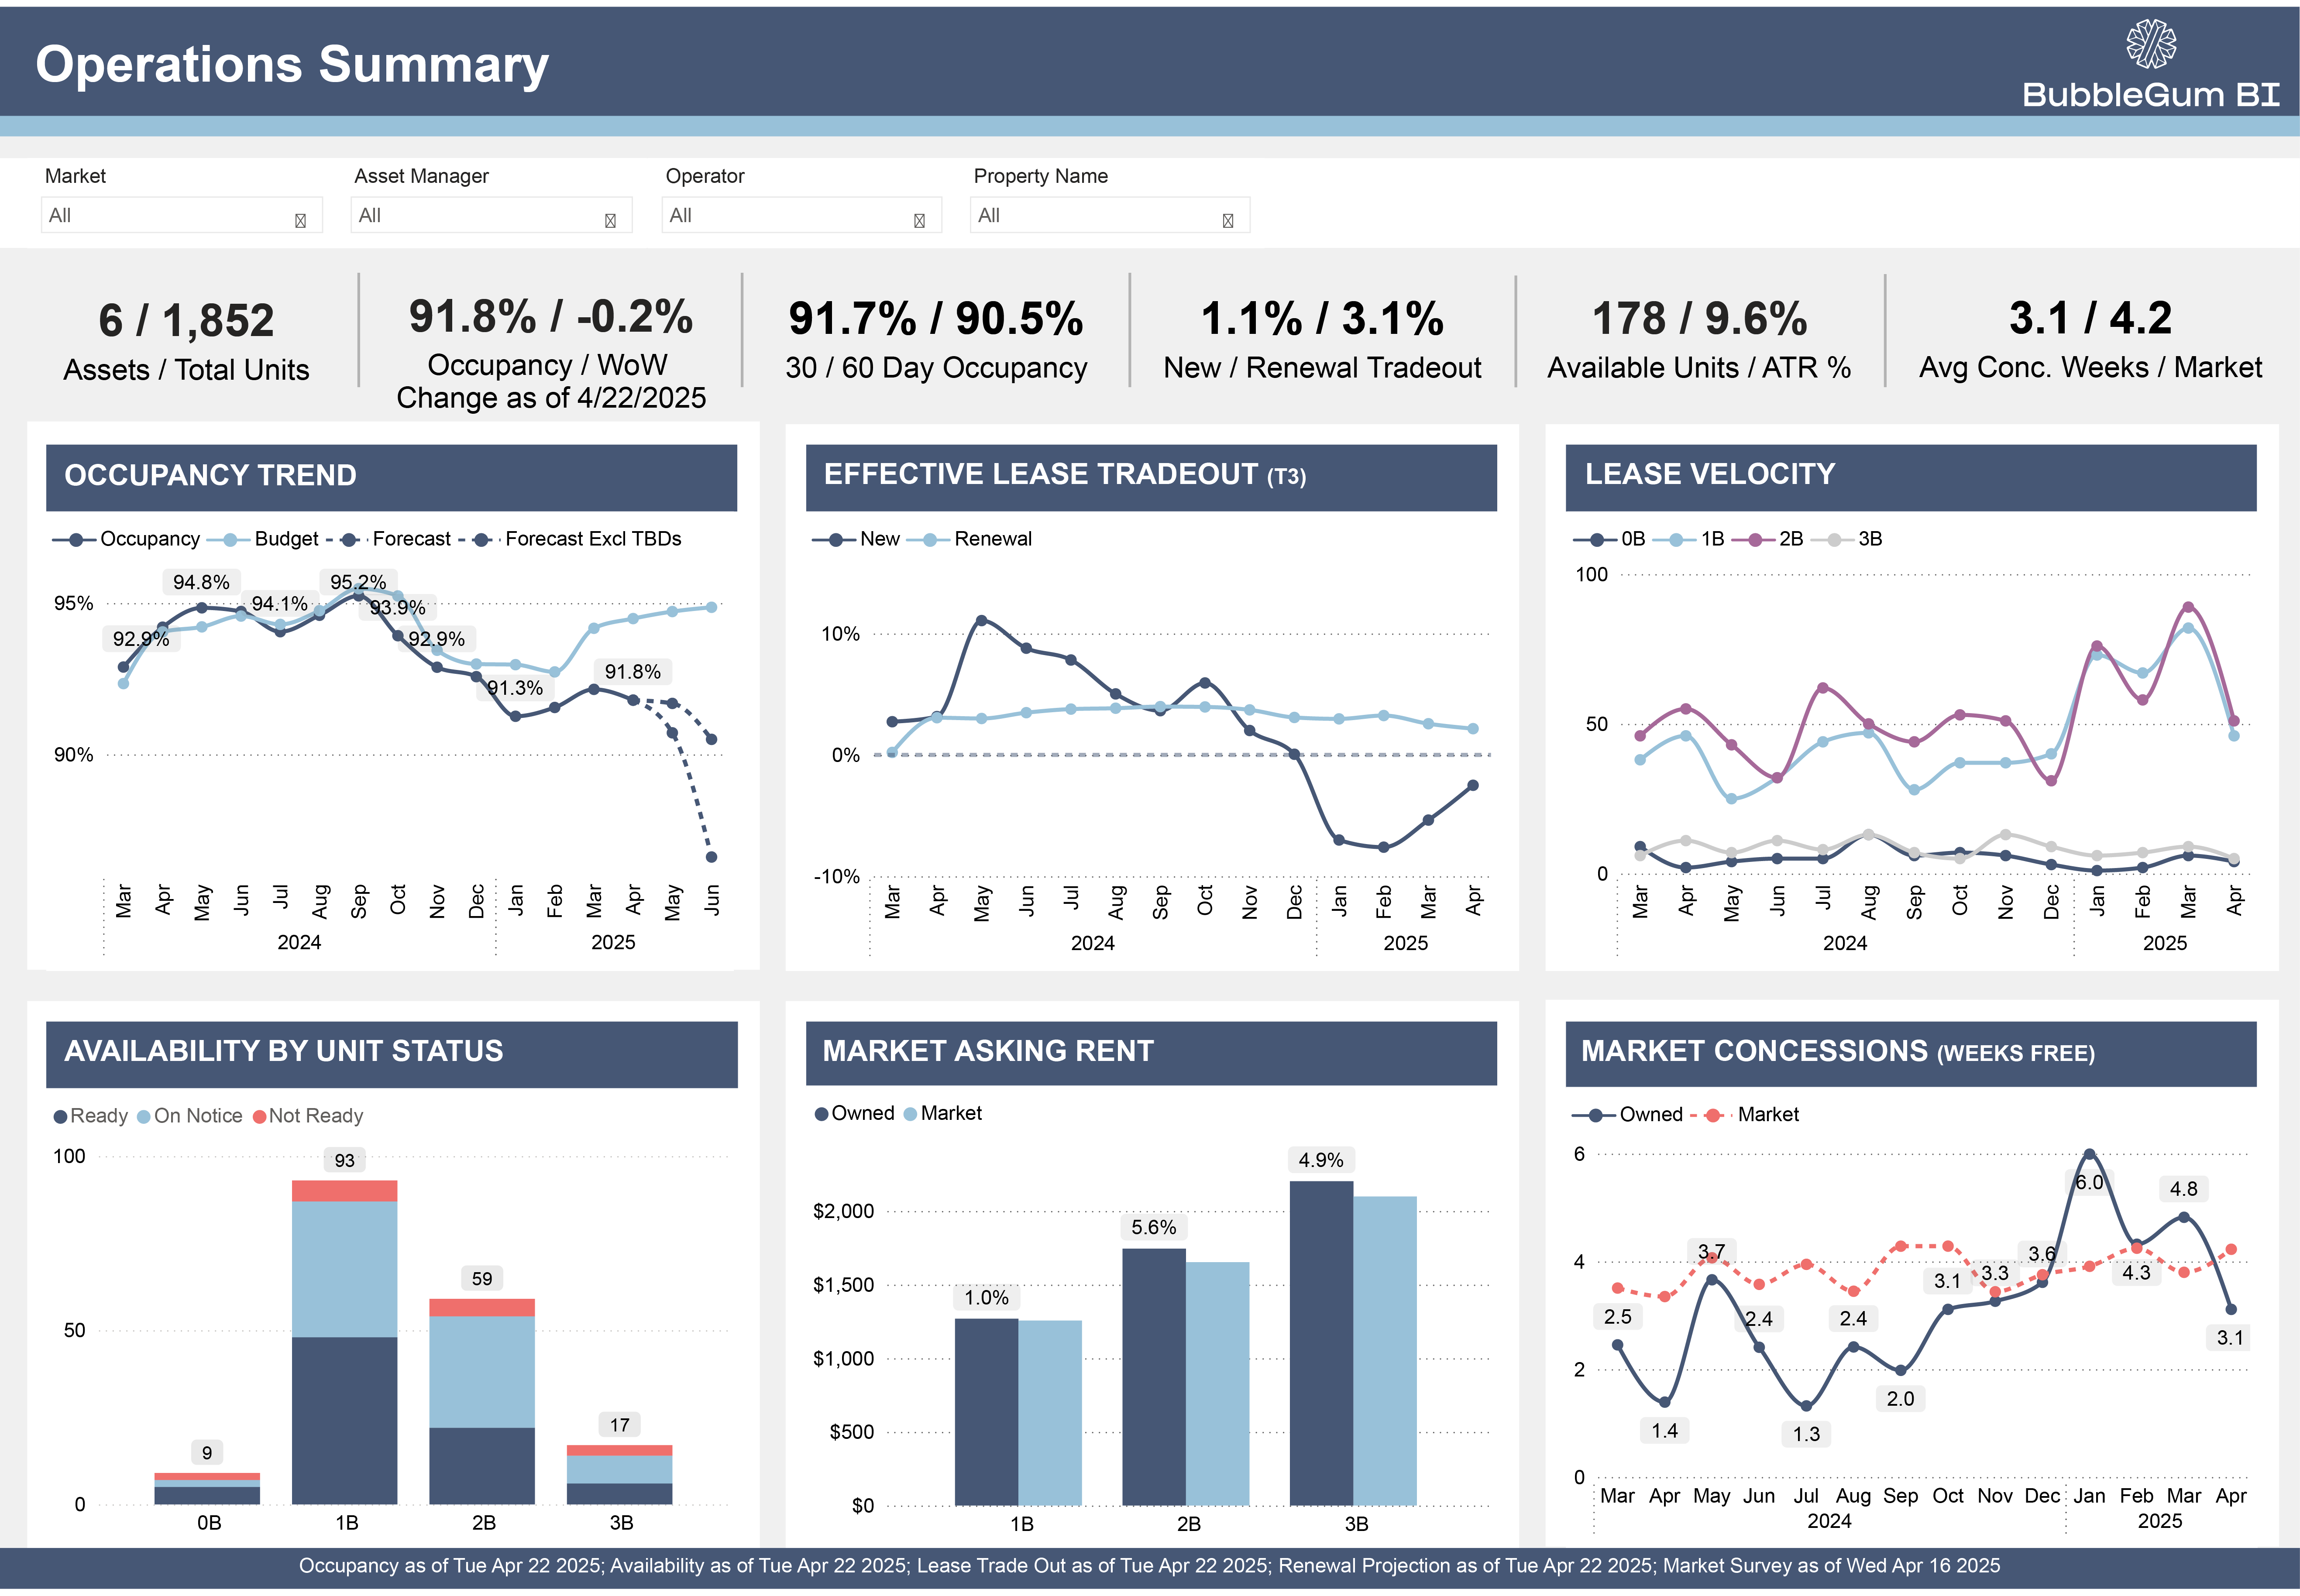
1. Occupancy & Leasing Analytics
- Real-time occupancy tracking – Physical and economic occupancy with daily updates
- Lease expiration analysis – Forward-looking availability and renewal risk assessment
- Leasing velocity metrics – Days to lease, application conversion, tour-to-lease rates
- Unit availability forecasting – Historical trend-based projections for proactive leasing
- Submarket benchmarking – Performance comparison against competitive set
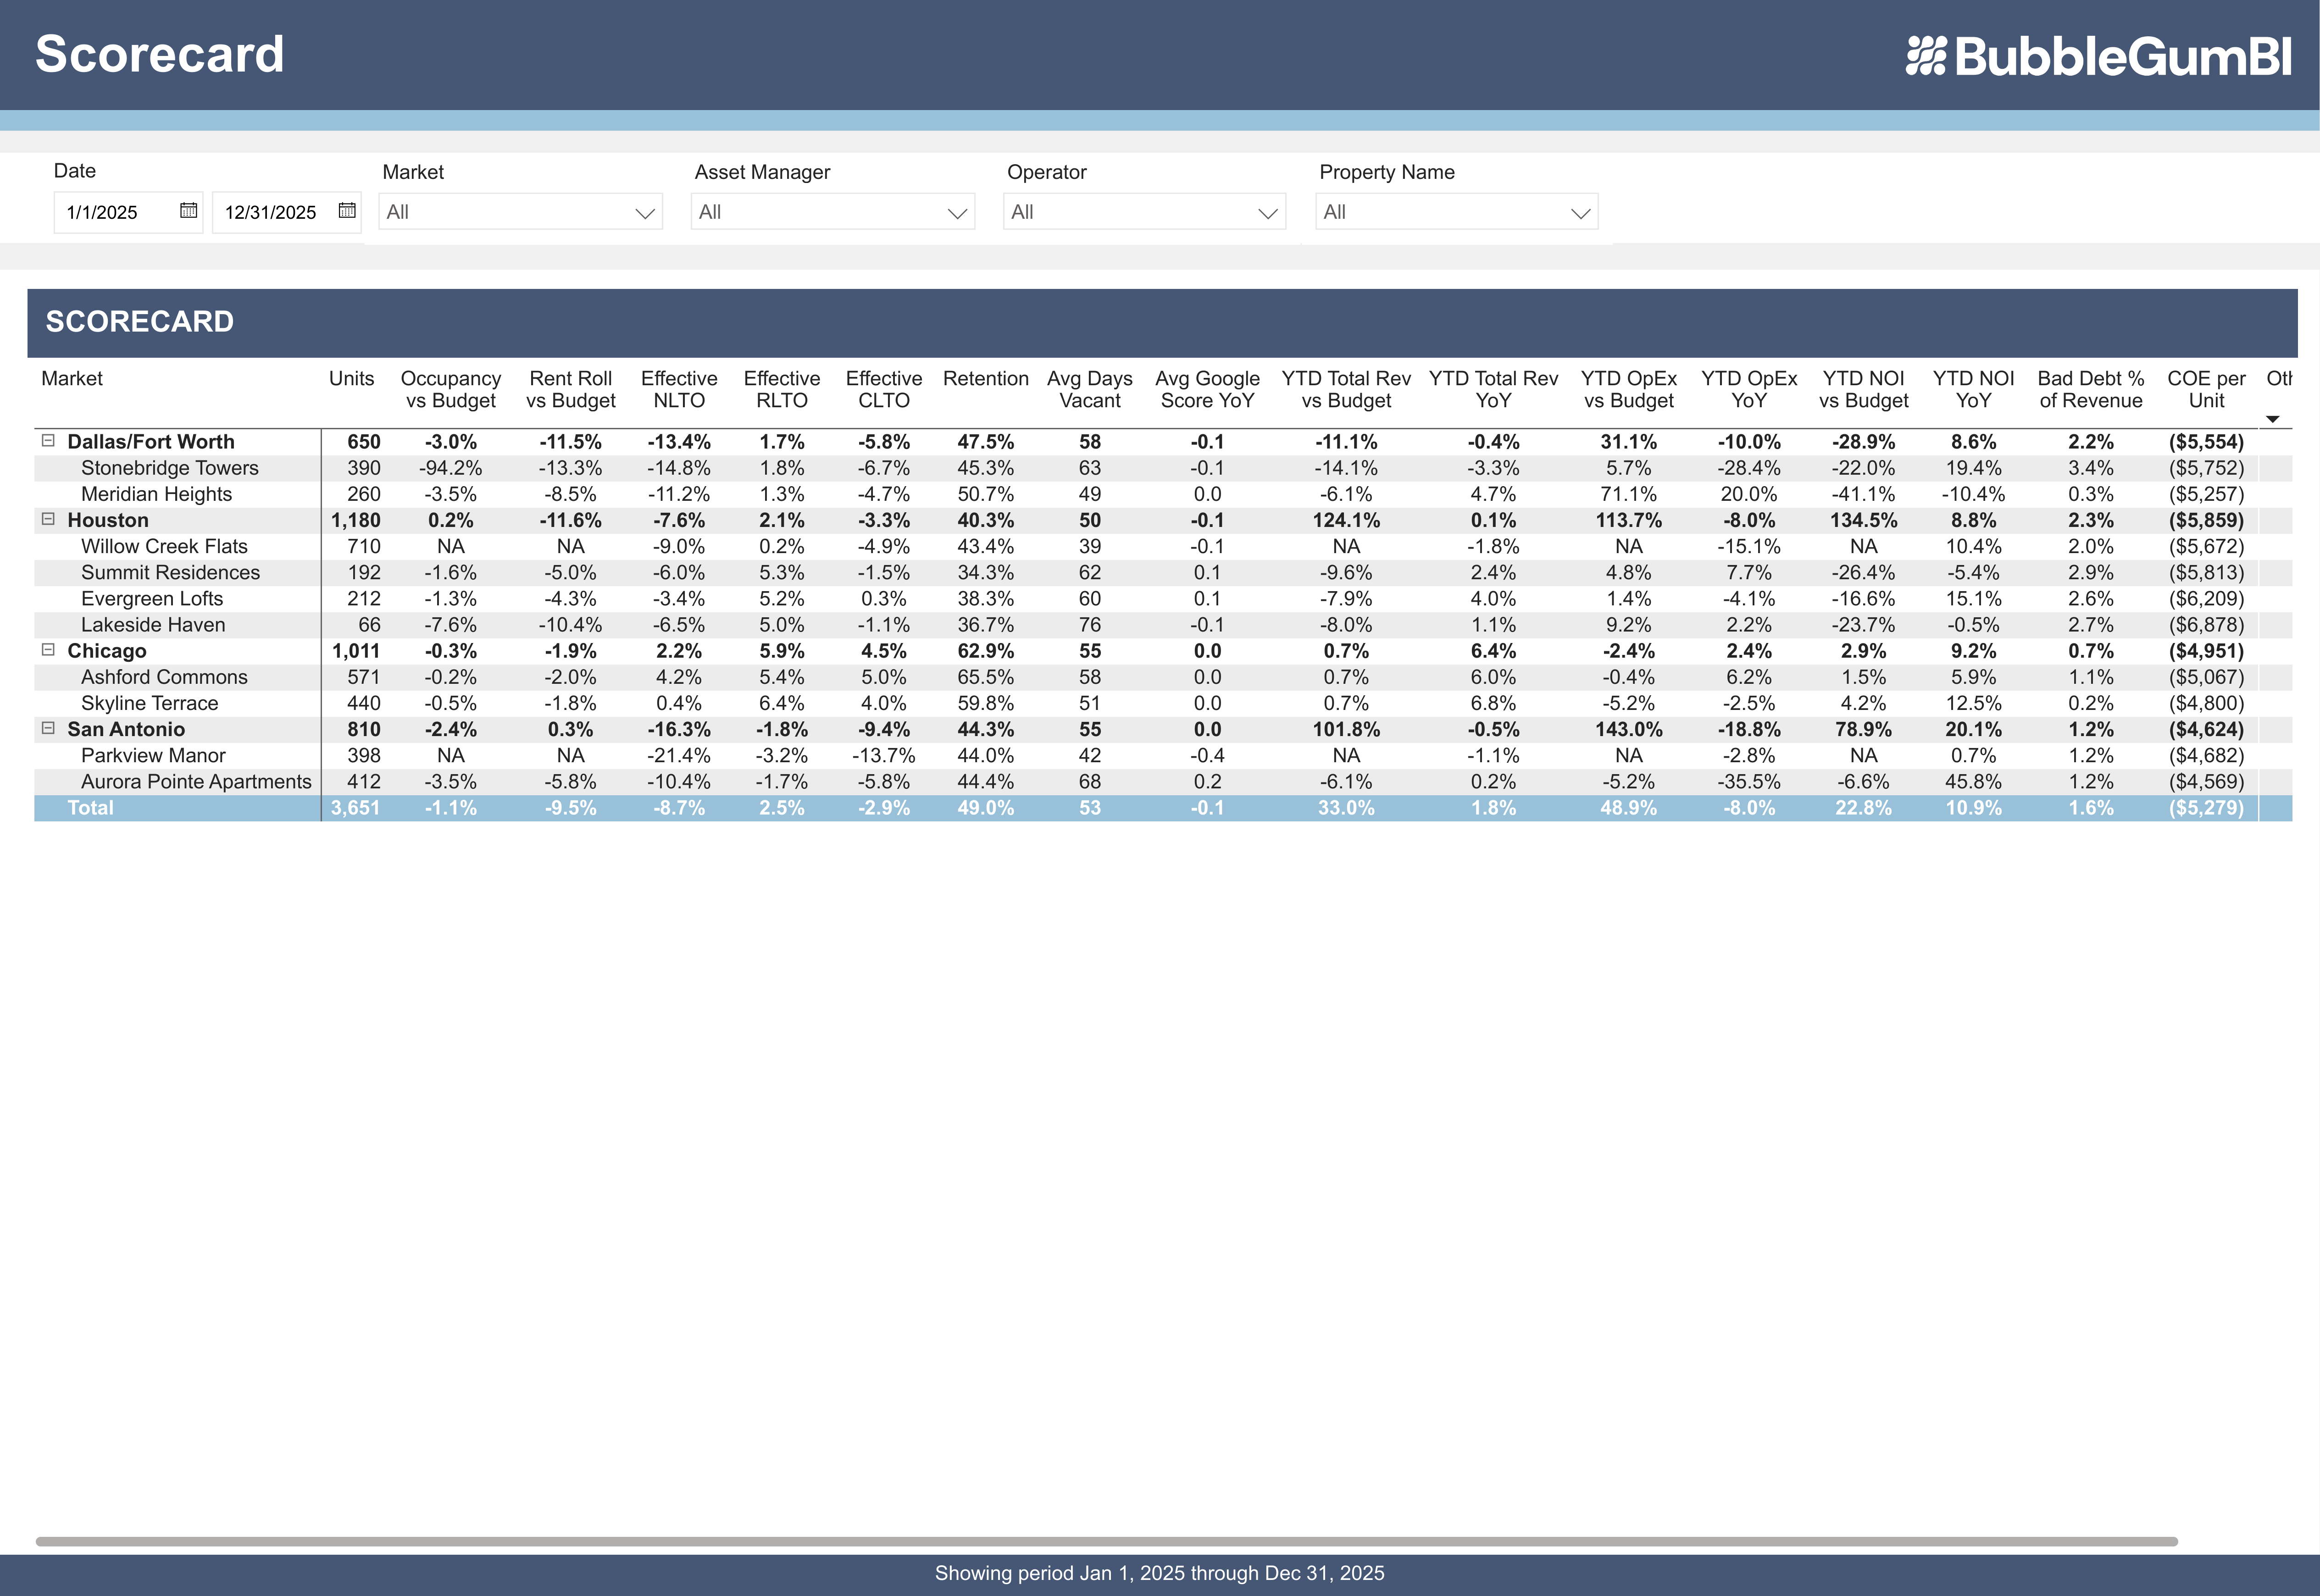
2. Financial Performance Analytics
- NOI tracking and trending – Income statement analysis with variance reporting
- Expense benchmarking – Property and portfolio-level cost comparison with operating expense ratio
- Utility rebill optimization – RUBS tracking and recovery gap identification
- Revenue per unit analysis – RevPU trending and optimization opportunities
- Budget variance analysis – Automated budget commentary integration
3. Retention & Renewal Analytics
- Renewal rate tracking – By property, floorplan, and unit type
- Renewal projection analytics – Forward-looking renewal forecasting
- Floorplan-specific pricing analysis – Identify pricing disconnects and opportunities
- Trade-out analysis – Renewal rent vs. new lease rent comparison
- Retention risk scoring – Early identification of non-renewal risk
4. Capital Investment & Renovation Analytics
- Unit Renovations Analytics – Classic to Renovated transition tracking
- Renovation ROI measurement – Rent premiums and payback period analysis
- Rent spread analysis – Classic vs. renovated pricing comparison
- Capital allocation prioritization – ROI-based investment decision support
- CapEx tracking – Budget vs. actual capital expenditure monitoring
5. Market Intelligence & Competitive Positioning
- Automated market surveys – 100% automated competitive intelligence via HelloData
- Property + 15 closest comps – Gross/effective rent, concessions, availability tracking
- Competitive positioning analysis – Market share and rate positioning insights
- Online reputation tracking – Google review monitoring and competitor comparison
- Market trend identification – Submarket absorption and pricing pattern analysis
🔍 Key Differentiator:
BubbleGum BI's HelloData integration provides 100% automated market intelligence—your property plus 15 closest comps—updating automatically without manual surveys. This saves asset managers 5-10 hours weekly compared to manual competitive intelligence gathering, while providing more comprehensive and consistent data for pricing decisions.
AI Integration in BI Platforms: What to Look For in 2026
AI has moved from buzzword to baseline capability in multifamily analytics. With 30-50% of proptech VC funding now directed toward AI-focused BI companies (up from ~20% in 2024), understanding what constitutes genuine AI capability versus marketing hype is critical for platform selection.
Real AI Capabilities vs. "AI-Washing"
The market is flooded with vendors claiming "AI-powered" solutions. Here's how to distinguish authentic AI features from superficial rebranding:
✅ Real AI Features
- Anomaly detection – Automatically flags unusual patterns in occupancy, collections, or expenses
- Predictive forecasting – Projects renewal probability, lease-up velocity, and revenue using ML models
- Natural language queries – Ask questions in plain English, get instant answers from your data
- Automated insights generation – AI surfaces problems and opportunities without manual analysis
- Intelligent alerting – Context-aware notifications that learn from your portfolio patterns
❌ AI-Washing Red Flags
- Rebranded reporting – Static dashboards relabeled as "AI-powered"
- Basic automation marketed as AI – Scheduled reports or simple if-then rules
- Chatbots with no data access – Generic AI assistants that can't query your actual portfolio
- Vague "machine learning" claims – No specific explanation of what models do or how they improve
- "Coming soon" AI roadmaps – Promised features used to justify premium pricing today
AI Capabilities Transforming Multifamily BI in 2026
Several platforms are leading with substantive AI integration:
- AI Copilots for pricing – Platforms like Rentana now offer AI Copilot features that analyze market conditions, historical performance, and competitive positioning to recommend optimal pricing strategies in real-time
- AI-infused CRM and leasing – Funnel's AI-powered CRM automates lead scoring, communication timing, and follow-up sequences based on prospect behavior patterns
- Predictive maintenance – AI models that predict equipment failures before they occur, reducing emergency maintenance costs and resident disruption
- Natural language analytics – Ask your BI platform "Which properties are underperforming on renewals this quarter?" and get instant, accurate answers
- Automated market intelligence – AI-powered comp identification and pricing analysis that evolves with market conditions
🤖 The AI Evaluation Framework:
When evaluating AI claims, ask vendors three questions: (1) What specific decisions does your AI help automate? (2) Can you show before/after outcomes from clients using the AI features? (3) How does the AI improve over time with more data? Genuine AI capabilities will have clear, specific answers to all three.
Market Intelligence Evolution: The Data Arms Race
The market intelligence landscape has transformed significantly, with major acquisitions reshaping competitive dynamics:
- REBA + Markerr (December 2025) – REBA's acquisition of Markerr significantly enhanced their market data capabilities, combining demographic intelligence with operational benchmarking
- Radix Analytics – Now tracking millions of units in real-time, providing institutional-grade market intelligence previously available only to the largest owners
- ApartmentIQ – Offering historical market data back to 2020, enabling longitudinal trend analysis and more accurate seasonal forecasting
- RealPage expansion – Continuing to expand resident experience features while integrating deeper AI-driven pricing recommendations
For mid-market operators, these developments mean more sophisticated market intelligence is now accessible without enterprise-level budgets. BubbleGum BI's HelloData integration, for example, brings automated comp tracking that previously required dedicated market research staff or expensive data subscriptions.
Real-World Use Cases: 5 Case Studies with Measurable Results
Purpose-built multifamily BI delivers tangible, measurable results. Here are five real BubbleGum BI case studies demonstrating specific outcomes across different use cases:
Case Study #1: Occupancy Optimization – 4.5% Improvement
Challenge: A multifamily property struggled with occupancy performance, sitting at 90.5% while the submarket averaged higher rates.
Solution: Using BubbleGum BI's Occupancy & Leasing dashboard combined with automated market intelligence from HelloData, the asset manager identified demand trends early and adjusted pricing and leasing strategies accordingly.
Results (9 months):
- 90.5% → 95% occupancy (4.5 percentage point gain)
- Outperformed submarket 7 consecutive months
- Revenue impact: Tens of thousands in additional rent revenue
- Decision speed: Daily data enabled weekly strategy adjustments
Case Study #2: Retention Strategy – 19% Improvement
Challenge: Renewal rates were stagnant, and the asset manager lacked visibility into what drove resident decisions to renew or vacate.
Solution: BubbleGum BI's Renewal Projection dashboard revealed a critical insight: 2-bedroom units had a pricing disconnect. Floorplan-specific analysis showed these units were overpriced relative to market and one-bedroom alternatives.
Results (8 consecutive months):
- 19% retention improvement sustained over 8 months
- Floorplan-specific pricing adjustments implemented
- Proactive renewal conversations based on data insights
- Turnover cost reduction through improved retention
Case Study #3: Renovation ROI – 25% Initial Premium, 10.8% Sustained
Challenge: The portfolio was investing in unit renovations, but lacked systematic tracking of actual ROI and rent premiums achieved.
Solution: BubbleGum BI's Unit Renovations Analytics tracked every lease transition—Classic to Classic, Classic to Renovated, and Renovated to Renovated—providing precise rent premium measurements.
Results:
- 25% initial rent premium on newly renovated units
- 10.8% sustained premium over 12+ months
- $0.20/sqft rent spread between classic and renovated units
- Data-driven prioritization of renovation investments
- Justified accelerated renovation program to ownership
Case Study #4: Turnover Cost Reduction – 19.1% Decrease, +1.1% NOI
Challenge: High turnover costs were eating into NOI, but the asset manager couldn't identify specific cost drivers or accountability gaps.
Solution: BubbleGum BI's Turnover & Damages dashboard provided per-moveout cost tracking and damage charge billing visibility, revealing both process inefficiencies and accountability issues.
Results:
- 19.1% per-moveout cost reduction
- +21% damage charge billing improvement through better documentation
- +1.1% NOI boost from combined cost reduction and revenue recovery
- Process improvements based on data-driven insights
- Operator accountability through transparent tracking
Case Study #5: Online Reputation – 3.6 to 4.6 Stars
Challenge: Online reputation was suffering with a 3.6-star Google rating, 78% review response rate, and ranking 9th among 15 competitors.
Solution: BubbleGum BI's Online Reputation feature provided Google review tracking plus 15-competitor comparison, enabling systematic reputation management and competitive benchmarking.
Results (5 months):
- 3.6 → 4.6 star rating improvement
- 100% review response rate (up from 78%)
- 9th → 3rd place competitive positioning (among 15 comps)
- Improved leasing conversion through better reputation
- Data-driven response strategy based on review themes
BubbleGum BI's Approach: Curated Dashboards from 50+ Industry Experts
What makes purpose-built multifamily BI fundamentally different from generic tools? The answer lies in the curation approach.
Generic BI platforms provide a blank canvas—incredibly powerful, but requiring months of work to define metrics, build dashboards, configure data connections, and establish workflows. You're essentially building your analytics platform from scratch.
BubbleGum BI takes the opposite approach: pre-configured dashboards curated from 50+ asset managers and operators. Every metric, every calculation, every dashboard view has been designed by multifamily professionals who understand:
- Income-statement impact – Focus on analytics that directly affect NOI
- Asset manager workflows – Dashboards designed for how asset managers actually work
- Decision-critical insights – Prioritize quality over quantity of metrics
- Benchmark standards – Pre-configured with industry-standard calculations and KPIs
- Proven methodologies – Analytics approaches that have delivered results across portfolios
⚡ Implementation Speed:
According to BubbleGum BI's implementation architecture, setup takes 24 hours once PMS credentials are provided. This compares to 3-6 months for generic BI tools requiring custom configuration, data modeling, and dashboard development. The "curated from 50+ asset managers" approach means you get proven analytics immediately, not after expensive consulting projects to build dashboards from scratch.
The BI Layer Architecture: On Top of Your PMS, Not Replacing It
A critical aspect of purpose-built multifamily BI is the integration architecture. BubbleGum BI functions as a BI analytics layer that sits on top of your existing property management system:
- One-way daily sync – Data flows from PMS to BI platform automatically each night
- No operational disruption – Property teams continue using familiar PMS systems
- Direct integrations – Native connections to Yardi, RealPage, and Entrata
- Maximizes PMS investment – Extracts strategic value from data already in your systems
- No data lock-in – Export capabilities (Excel, CSV, live datasets) ensure data access
This architecture is particularly valuable for portfolios managing properties across multiple PMS platforms or working with different operators. BubbleGum BI normalizes and standardizes data, enabling true apples-to-apples portfolio analytics regardless of underlying systems.
Implementation: From Setup to Value in 24 Hours
One of the most significant advantages of purpose-built multifamily BI is rapid time-to-value. Here's what 24-hour implementation looks like with BubbleGum BI:
Implementation Timeline:
Kickoff & Credentials (1 hour)
Provide PMS credentials and API access information. BubbleGum BI team configures secure connections.
Data Extraction & Validation (8-12 hours)
Automated extraction of historical and current data from PMS. Data validation and quality checks performed.
Dashboard Population (4-6 hours)
Pre-configured dashboards automatically populate with your property data. All metrics calculated and ready for review.
Platform Training & Handoff (1-2 hours)
Review dashboards with your team, configure alerts and scheduled reports, provide training on key features.
Total time: 24 hours from credentials to actionable insights. No months of consulting, no custom dashboard development, no data modeling required.
The ROI of Purpose-Built Multifamily BI
Asset managers consistently report significant return on investment from purpose-built BI platforms. Here's how the ROI breaks down:
| ROI Category | Typical Impact | Value Example (200 units) |
|---|---|---|
| Occupancy Improvement | 1-3% gain | +2 units occupied = $36,000-$60,000/year |
| Pricing Optimization | 2-5% revenue increase | $50-$100/unit improvement = $120,000-$240,000/year |
| Turnover Cost Reduction | 15-25% decrease | $300-$500 per turnover savings = $18,000-$30,000/year |
| Reporting Time Savings | 60-80% reduction | 10 hours/week saved = $30,000-$50,000/year in capacity |
| Better Capital Allocation | 15-25% higher renovation ROI | Varies by CapEx budget |
💰 Typical ROI:
Asset managers implementing purpose-built multifamily BI typically achieve 10-20x ROI in year one through combined improvements in occupancy, pricing, cost reduction, and operational efficiency. A 200-unit property can easily generate $200,000-$400,000 in additional value annually, making the subscription cost a fraction of the return delivered.
Key Features to Seek in Multifamily BI Platforms
When evaluating multifamily BI platforms in 2026, prioritize these essential capabilities—including emerging AI-powered features that are quickly becoming baseline expectations:
✅ Direct PMS Integrations
Native connections to Yardi, RealPage, Entrata eliminating manual data entry and ensuring daily automated updates.
✅ Pre-Configured Dashboards
Industry-curated analytics requiring no custom configuration. Look for platforms designed by multifamily professionals.
✅ Automated Market Intelligence
100% automated competitive data (property + 15 comps) without manual surveys. Saves 5-10 hours weekly.
✅ Mobile & Desktop Access
Full functionality on both platforms enabling portfolio monitoring anywhere, anytime.
✅ AI-Powered Anomaly Detection
Automatic flagging of unusual patterns in occupancy, collections, expenses, or leasing velocity—catching issues before they impact NOI.
✅ Predictive Analytics
ML-powered forecasting for renewal probability, lease-up projections, and revenue optimization—not just historical trend lines.
✅ Alerts & Scheduled Reports
Configurable threshold alerts and email delivery on any cadence for proactive management.
✅ Data Export Capabilities
Excel, CSV exports plus live dataset connections. No data lock-in or accessibility restrictions.
✅ Portfolio Benchmarking
Cross-property analytics with standardized metrics regardless of PMS platform or operator.
✅ Natural Language Queries
Ask questions in plain English and get instant answers from your data—no SQL or technical skills required.
Common Pitfalls When Choosing BI for Multifamily
Avoid these common mistakes when selecting a multifamily BI platform:
❌ Pitfall #1: Choosing Generic BI Without Understanding Implementation Costs
Generic BI tools (Tableau, Power BI) appear cost-effective initially, but the true cost includes:
- 3-6 months consulting fees ($50,000-$200,000)
- Ongoing maintenance and updates as business requirements evolve
- Specialized staff (data analysts, BI developers)
- Total cost of ownership often 3-5x purpose-built alternatives
❌ Pitfall #2: Relying Solely on PMS Reporting
PMS systems provide operational reports, not strategic analytics. Limitations include:
- No cross-property portfolio benchmarking
- Limited market intelligence and competitive positioning
- Difficult historical trend analysis and forecasting
- Operations-focused metrics, not asset manager decision support
❌ Pitfall #3: Not Validating Multifamily-Specific Expertise
Many BI vendors claim multifamily capabilities. Verify actual expertise. For a comprehensive comparison of multifamily BI platforms and their positioning, see our Multifamily BI Platform Landscape: 2026 Comparison Guide.
- Was the platform built by multifamily professionals?
- Are dashboards pre-configured for multifamily metrics?
- Do they understand income-statement impact?
- Can they provide multifamily-specific case studies with real results?
❌ Pitfall #4: Falling for AI-Washing
With 30-50% of proptech VC flowing to AI-focused companies, every vendor now claims "AI-powered" capabilities. Many are rebranding existing features.
- Ask for specific examples of what the AI actually does
- Request before/after outcomes from clients using AI features
- Verify whether "AI" means genuine machine learning or just automated rules
- Be skeptical of "coming soon" AI roadmaps used to justify current pricing
- Look for platforms with demonstrated AI outcomes, not just AI marketing
Frequently Asked Questions: Multifamily Business Intelligence in 2026
What is business intelligence in multifamily real estate?
Business intelligence for multifamily is a specialized analytics platform that integrates with your property management system (Yardi, RealPage, and Entrata) to transform operational and financial data into actionable insights. Unlike generic BI tools or basic PMS reports, purpose-built multifamily BI provides pre-configured dashboards for occupancy, financials, renewals, renovations, and market intelligence—designed specifically for asset managers and directors of operations.
Why choose purpose-built multifamily BI over generic tools like Tableau or Power BI?
Generic BI tools require months of custom configuration, data modeling, and ongoing maintenance. Purpose-built platforms like BubbleGum BI offer pre-configured dashboards curated from 50+ asset managers and operators, delivering value in 24 hours instead of months. You get multifamily-specific metrics (occupancy trends, renewal projections, renovation ROI, turnover costs) out-of-the-box, not after expensive consulting projects.
What results can multifamily operators expect from implementing BI analytics?
Real BubbleGum BI case studies show measurable results: 4.5% occupancy improvements (90.5% to 95%), 19% retention increases through pricing analysis, 25% sustained rent premiums from renovations, 19% turnover cost reductions (+1.1% NOI boost), and reputation improvements from 3.6 to 4.6 stars. Asset managers typically see 2-5% NOI improvements and 60-80% reduction in reporting time within the first year.
How long does it take to implement multifamily BI analytics?
With BubbleGum BI's direct PMS integrations and pre-configured dashboards, implementation takes 24 hours once credentials are provided. Generic BI tools require 3-6 months of custom configuration. The "curated from 50+ asset managers" approach means you get proven analytics immediately, not after expensive consulting projects to build dashboards from scratch.
Do I need a data science background to use multifamily BI effectively?
No. Purpose-built platforms like BubbleGum BI provide pre-configured dashboards designed specifically for asset managers and directors of operations—no technical expertise required. The dashboards are curated based on income-statement impact, showing only metrics that matter. If you can read a rent roll, you can use BubbleGum BI. Mobile and desktop access make it accessible anywhere.
How does market intelligence integration work in multifamily BI?
BubbleGum BI integrates with HelloData to provide 100% automated market intelligence—your property plus 15 closest comps showing gross/effective rent, trade-outs, availability %, concessions, and executed rent analysis. This competitive benchmarking updates automatically, unlike manual market surveys, enabling data-driven positioning decisions based on real-time market conditions.
What's the ROI of implementing dedicated multifamily BI?
Asset managers typically see 10-20x ROI in year one through: improved occupancy (tens of thousands per property), optimized pricing (2-5% revenue gains), reduced turnover costs (30-50% savings), better capital allocation (15-25% higher renovation ROI), and time savings (60-80% reduction in reporting time). Real case studies show 1-5% NOI improvements from data-driven decision-making.
How is AI changing multifamily BI platforms in 2026?
AI is rapidly becoming table stakes in multifamily BI, with 30-50% of proptech VC funding now directed toward AI-focused analytics companies. Genuine AI capabilities include anomaly detection (automatically flagging unusual patterns), predictive analytics (forecasting renewal probability and lease-up velocity), natural language queries (asking questions in plain English), and automated insight generation. However, only 28% of property professionals have actually deployed AI despite 45% understanding its potential—creating a competitive advantage for early adopters. When evaluating vendors, distinguish between real AI features and "AI-washing" by asking for specific examples and measurable outcomes.
Key Takeaways: Multifamily Business Intelligence in 2026
- Purpose-built platforms deliver value in 24 hours through pre-configured dashboards curated from 50+ asset managers, compared to 3-6 months for generic BI tools
- AI integration is now table stakes: 30-50% of proptech VC funding flows to AI-focused BI companies, up from ~20% in 2024—but only 28% of operators have deployed AI despite 45% understanding its potential
- Real case studies demonstrate measurable results: 4.5% occupancy gains, 19% retention improvements, 25% renovation ROI, 19% turnover cost reductions, and reputation improvements from 3.6 to 4.6 stars
- Market intelligence is consolidating: REBA's Markerr acquisition, Radix tracking millions of units, and ApartmentIQ's historical data back to 2020 signal a data arms race
- 100% automated market intelligence via HelloData (property + 15 comps) saves 5-10 hours weekly compared to manual competitive surveys
- BI layer architecture sits on top of existing PMS (Yardi, RealPage, Entrata) maximizing current investments without operational disruption
- Asset managers typically achieve 10-20x ROI in year one through combined improvements in occupancy, pricing, cost reduction, and 60-80% reporting time savings
- Watch for AI-washing: Evaluate vendors by asking for specific AI outcomes, not marketing claims—genuine AI features have demonstrable before/after results
Conclusion: The Future of Data-Driven Asset Management
The multifamily industry has reached an inflection point where data-driven decision-making is no longer a competitive advantage—it's table stakes. Asset managers who continue relying on monthly PMS reports, manual spreadsheets, and reactive management will increasingly find themselves outperformed by competitors leveraging purpose-built BI analytics with integrated AI capabilities.
The numbers tell a compelling story: while 45% of property professionals understand AI's potential, only 28% have actually deployed it. This adoption gap—combined with 30-50% of proptech VC funding now flowing to AI-focused BI companies—creates a significant competitive window for early movers. The M&A activity reshaping the landscape (REBA + Markerr, RealPage's expansion, Radix's real-time tracking of millions of units) signals that sophisticated market intelligence is rapidly becoming commoditized. The question isn't whether to embrace these tools, but how quickly.
The good news? The tools required to transform your portfolio's performance are available today, affordable, and deliver results in days, not months. Purpose-built multifamily BI platforms like BubbleGum BI have democratized access to sophisticated analytics that were once available only to the largest institutional portfolios with dedicated data teams.
Whether you're managing 5 properties or 500 units, the case studies presented in this guide demonstrate that measurable improvements—4.5% occupancy gains, 19% retention increases, 25% renovation premiums, 19% turnover cost reductions—are achievable through systematic application of data analytics. And with AI-powered features like anomaly detection, predictive forecasting, and natural language queries becoming standard, the performance gap between data-driven and traditional operators will only widen.
The question facing asset managers in 2026 isn't whether to implement BI analytics—it's how quickly you can get started. Every day without daily-updated dashboards, automated market intelligence, AI-powered insights, and portfolio-level analytics represents missed opportunities and suboptimal decisions.
For asset managers and directors of operations ready to transform their approach to portfolio management, purpose-built multifamily BI offers a clear path forward: rapid implementation, measurable results, and a sustainable competitive advantage built on data-driven excellence.
See BubbleGum BI on Your Own Assets
In a portfolio walkthrough, we'll show you how multifamily asset managers use BubbleGum BI to track occupancy, financial performance, and market position across their portfolios.