

July has been our biggest release yet, so much so that we were worried about fitting it all in one update. The two things we're most excited about are Cai's Excel plugin and Pipelines. We can't wait to see what you build!
Shipped
Cai in Excel
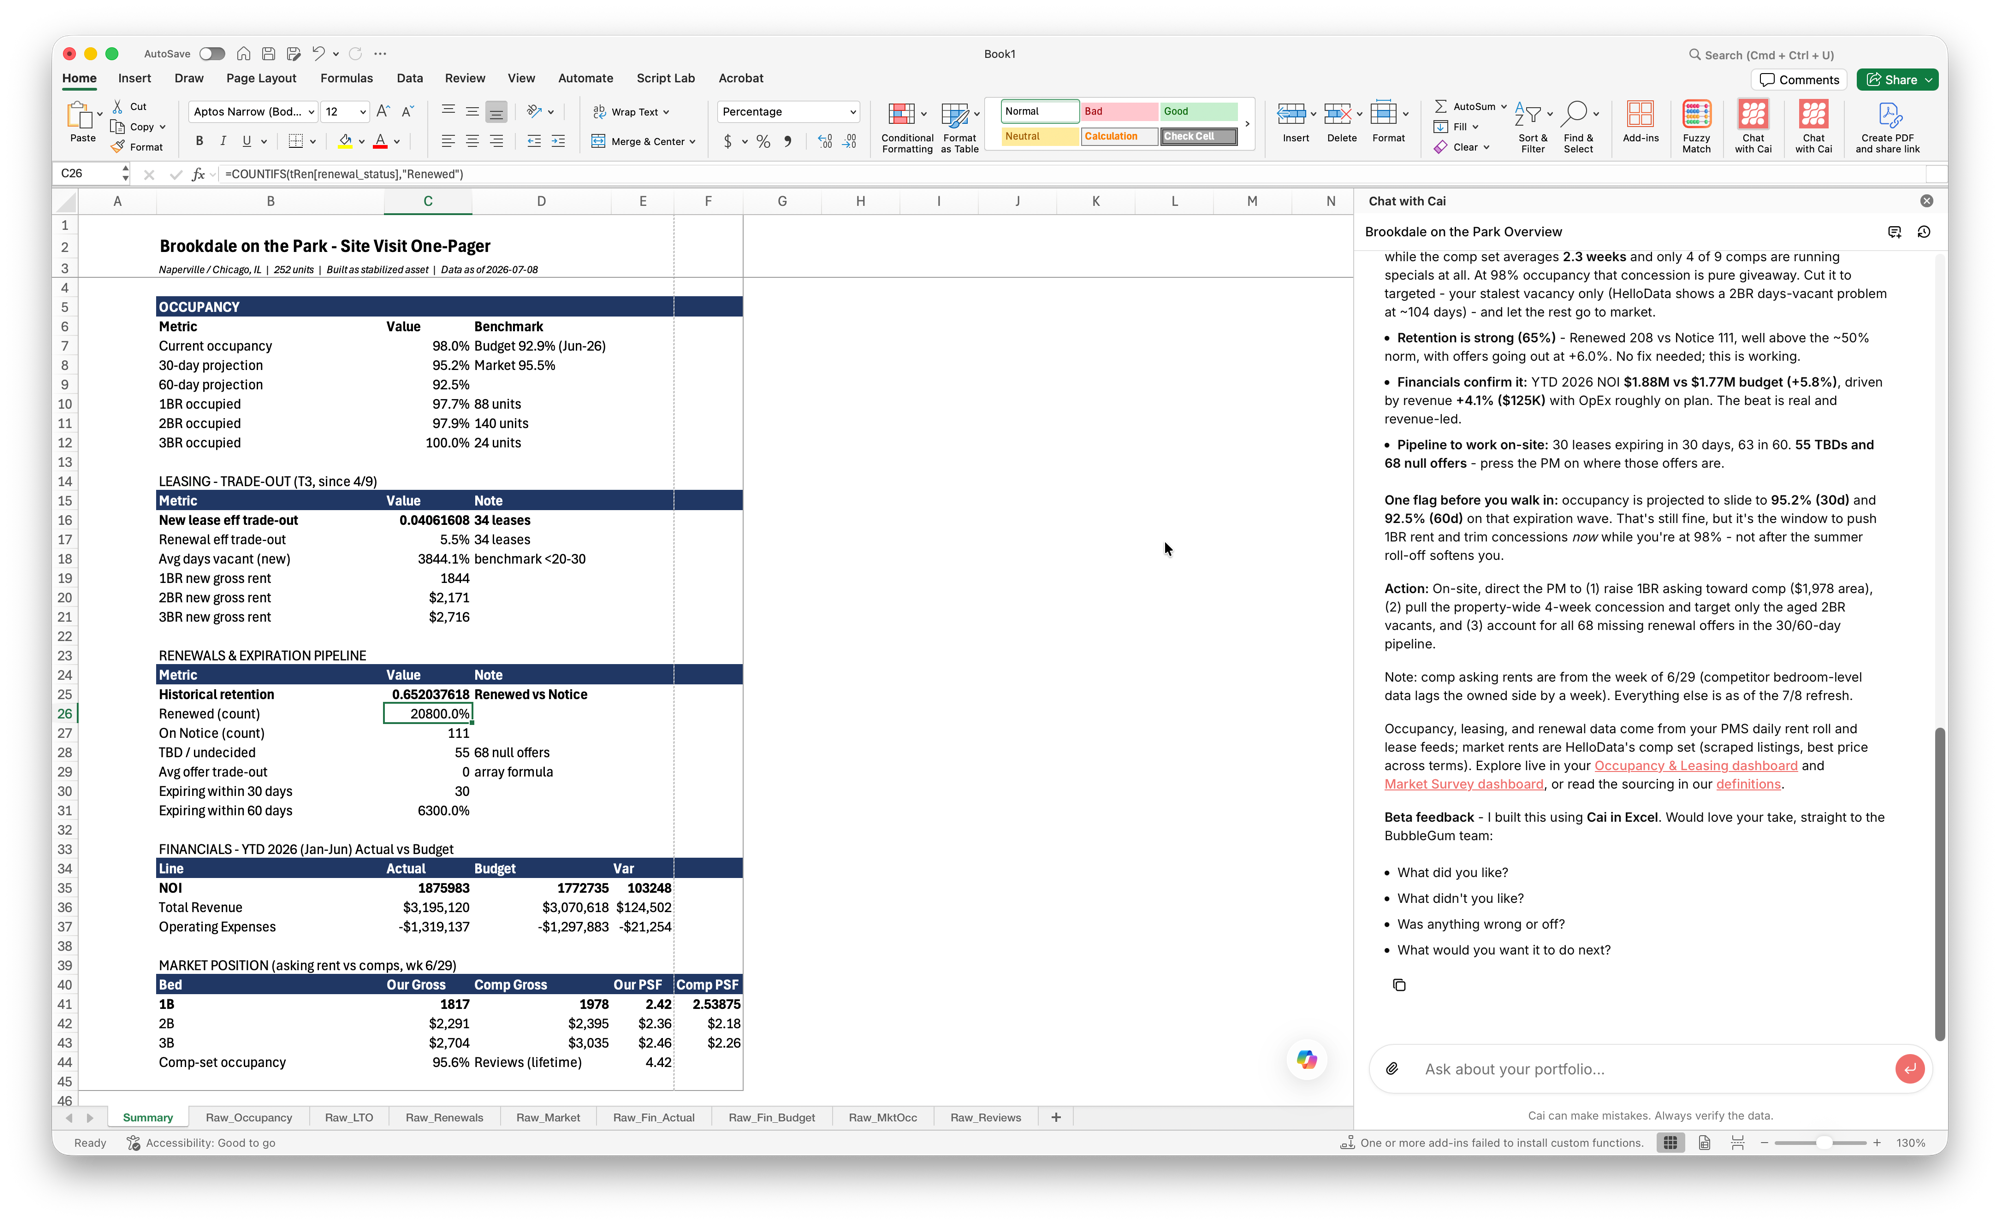
Cai in Excel is a BubbleGum add-in that puts Cai right inside your spreadsheet, working on the same validated portfolio data you use in the app. A few things it does:
- Pulls real data in as Excel tables. The way Cai cites its data in web chat, in Excel those citations land as native Excel tables you can audit.
- Builds on formulas, not pasted values. Cai is far stronger with formulas now: your summaries and reports reference those tables, so every figure traces back and recalculates when the data changes.
- Uses your colors and formatting. Cai applies your brand colors and house formatting and leaves the sheet clean and print-ready.
Great for building a report from scratch, migrating one you already hand-key so it runs off the BubbleGum warehouse, or riding along as a co-pilot in the sheets you already keep. Your admin turns it on for the team. Get it set up →
Pipelines: Track Anything, Build It With Cai
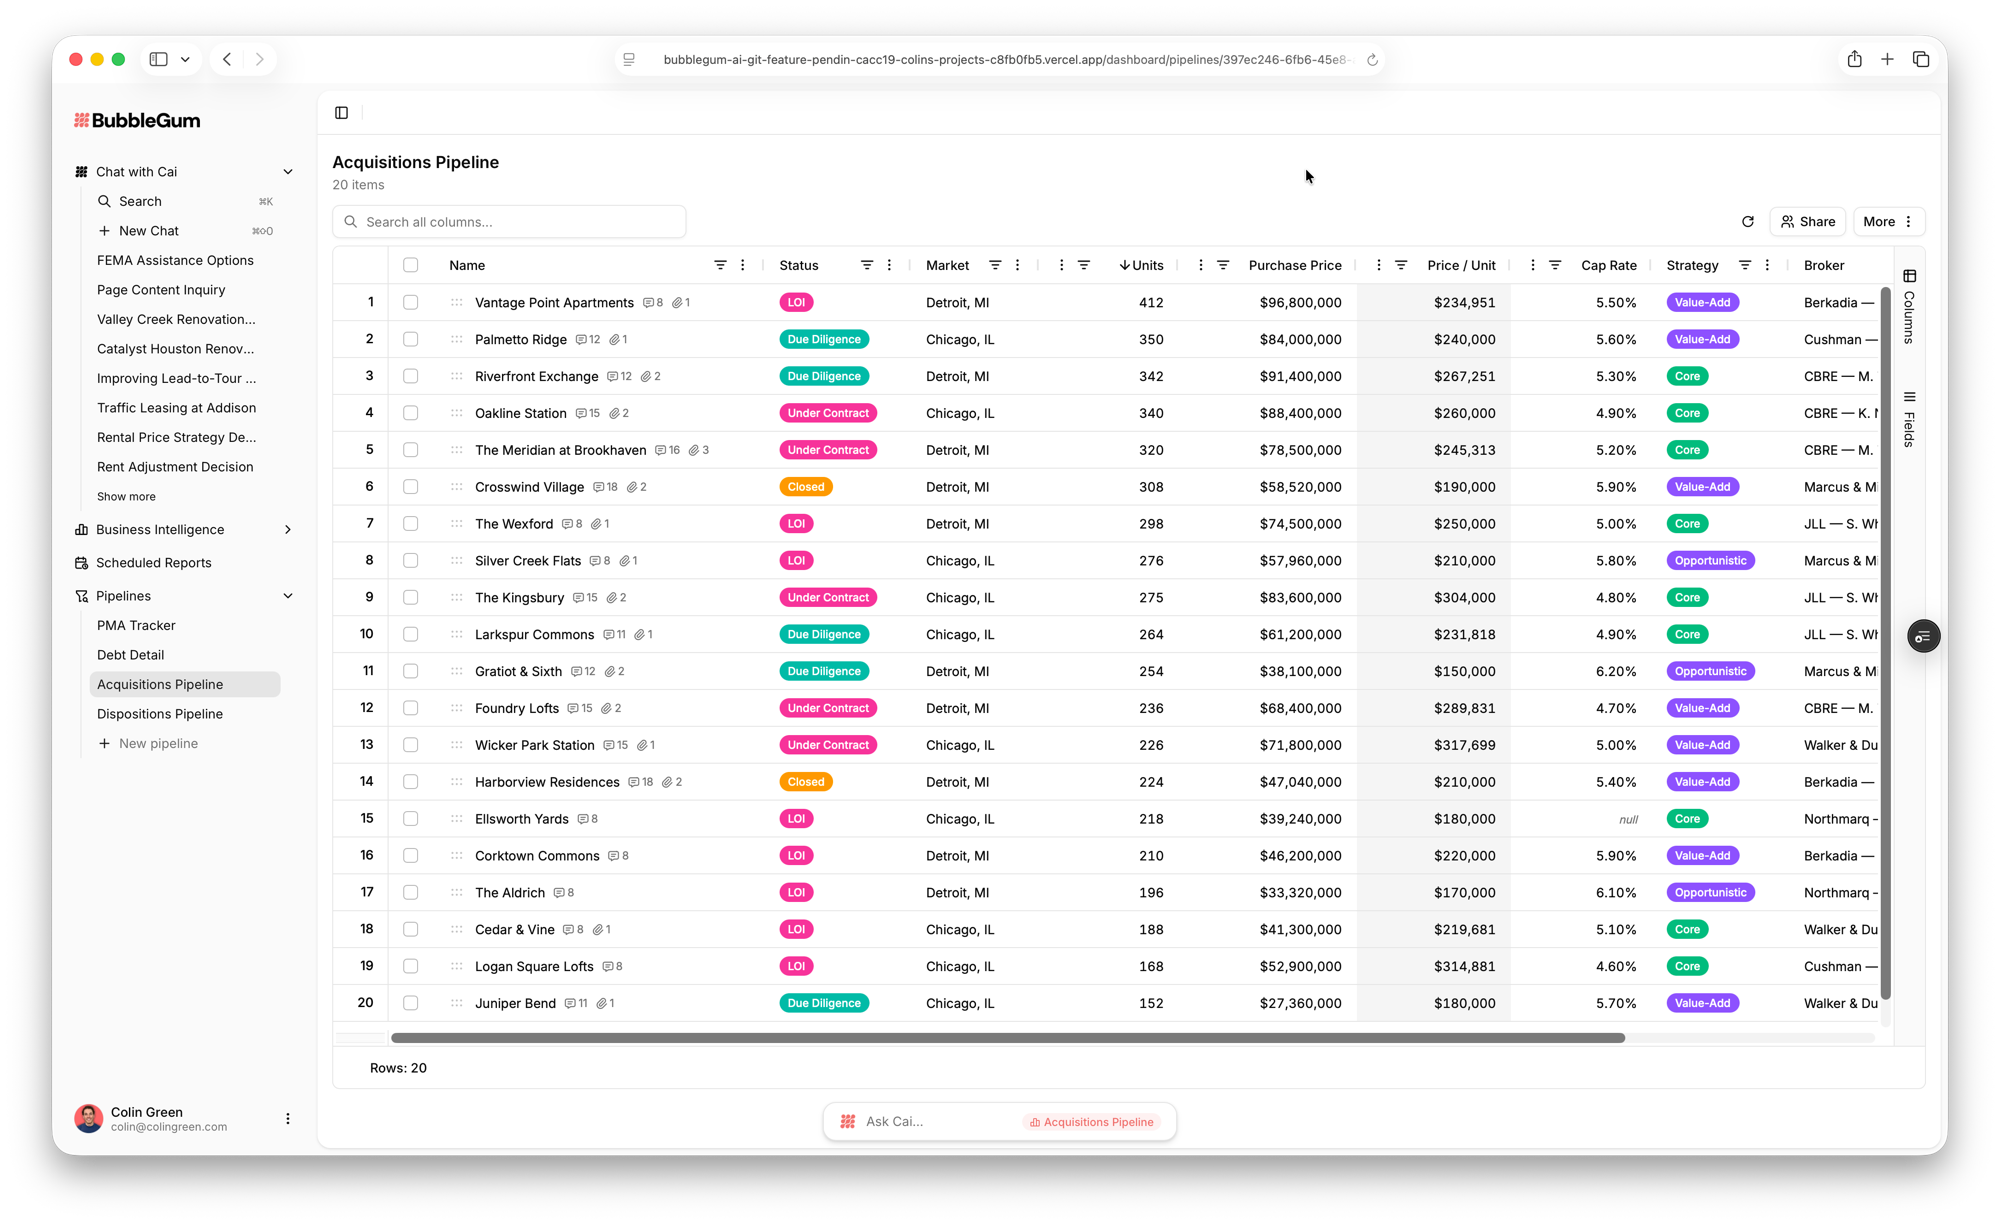
Pipelines is a tracking table you build yourself, right inside BubbleGum: custom and formula columns, stages, comments, attachments, and a full change history on every row. Drop in a spreadsheet you already keep and Cai stands up the whole thing for you, then reshapes the grid on command ("group by stage and total the deal amounts"). Share it at the access level you choose and export a branded copy in your colors. A few favorites from teams already using it:
- Acquisitions and dispositions pipelines. Every deal from first look to close: units, price, cap rate, stage, and broker.
- Debt detail. Loans, lenders, rates, and maturities, with covenant headroom in view.
- PMA tracker. Management agreements, fee terms, and renewal dates.
- Development budget. Line items, guidance, and variance as a project moves.
- AMI limits and affordable compliance. Income limits, set-aside mix, and recertification dates by property, so a unit never slips out of compliance.
Daily and Weekly Prep Briefings
You have always been able to connect your email to Cai. New this month: Cai uses it to read your calendar and get you ready for what is ahead.
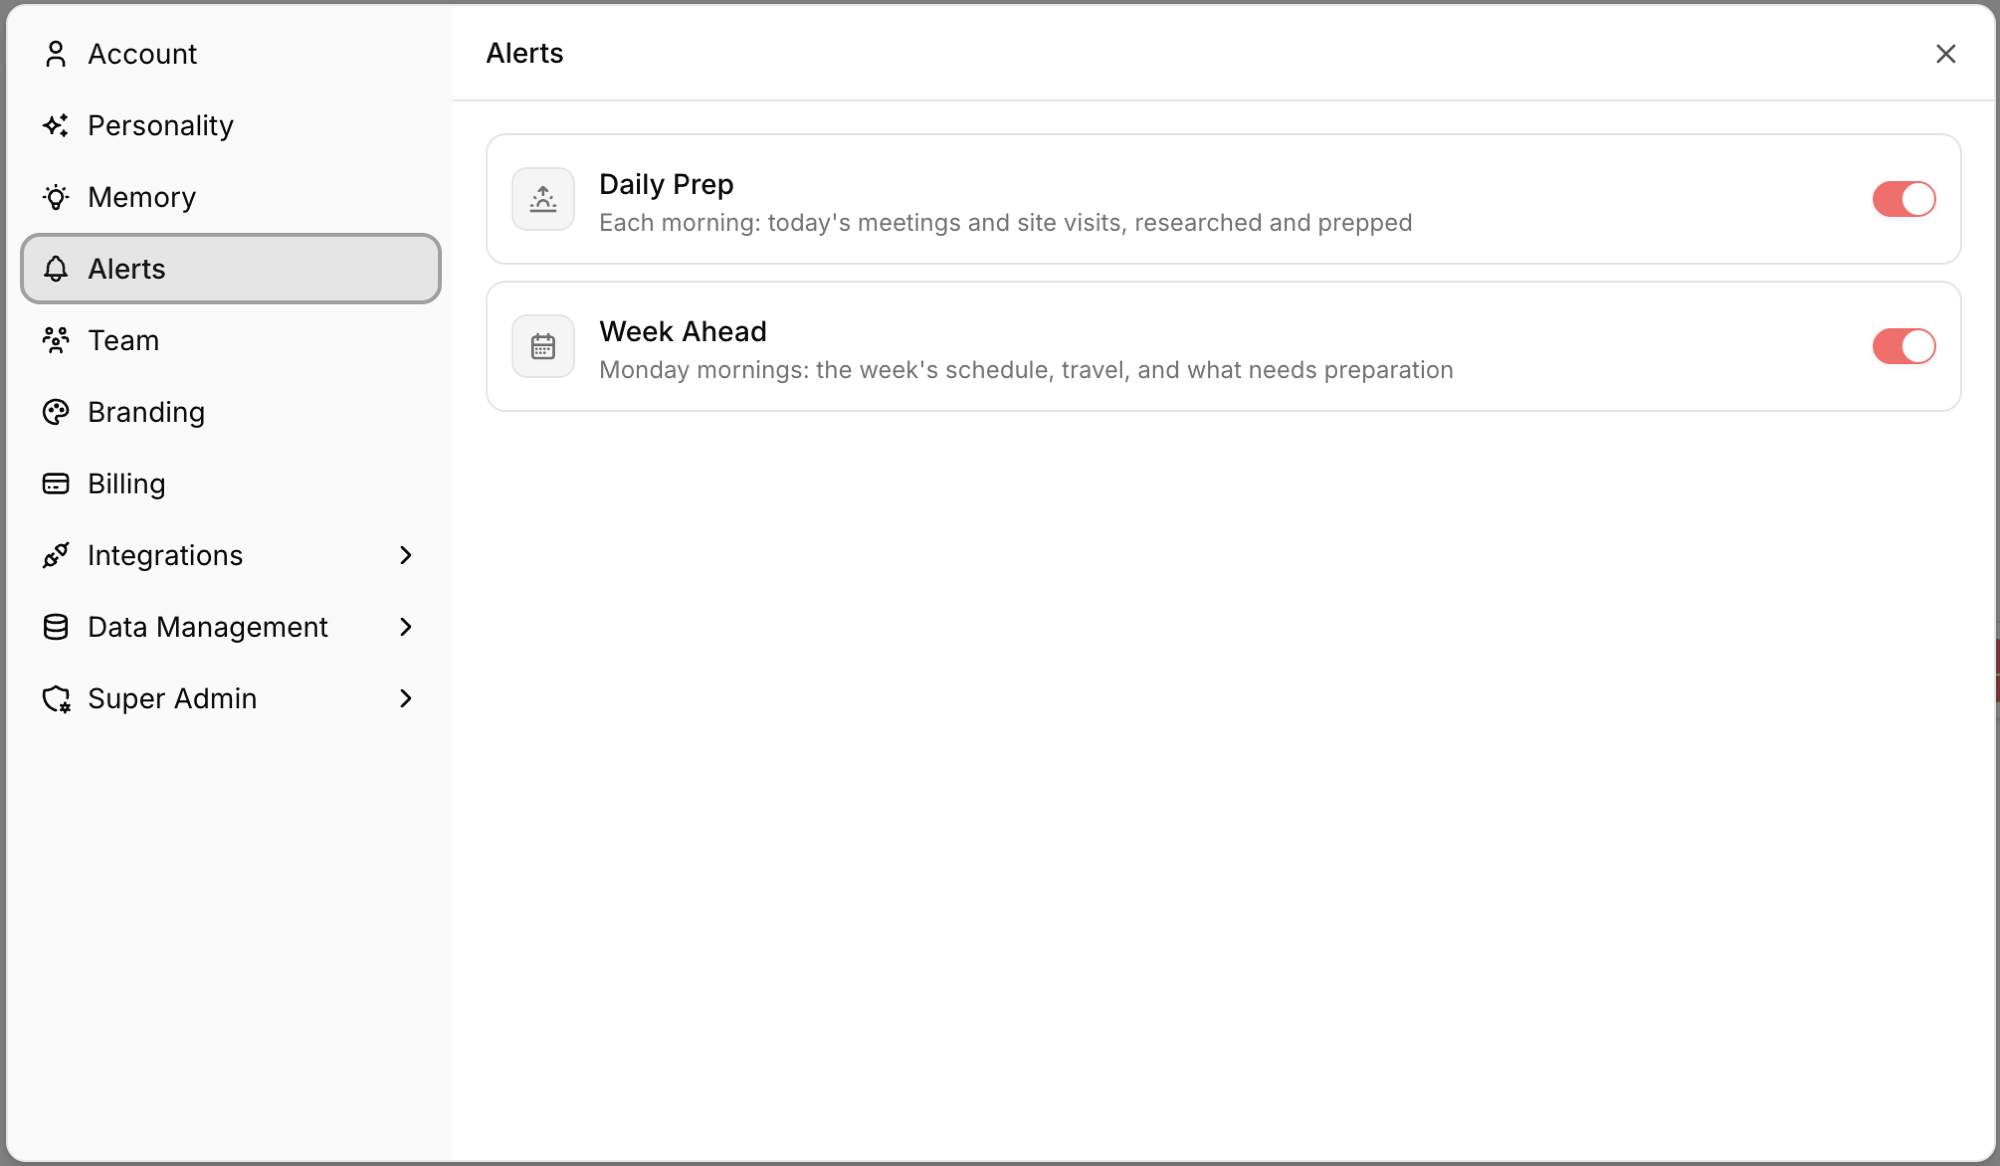
- A prep in your inbox each morning. Cai emails you a briefing for the day's meetings and site visits, researched and ready, so you walk in already up to speed.
- A Monday "week ahead." A rundown of the week's schedule, travel, and what needs preparing before it lands on you.
- On as soon as your email is connected. Connect email under Settings and you're enrolled automatically. Turn either briefing on or off under Settings, then Alerts.
Scheduled Reports Now Include Charts
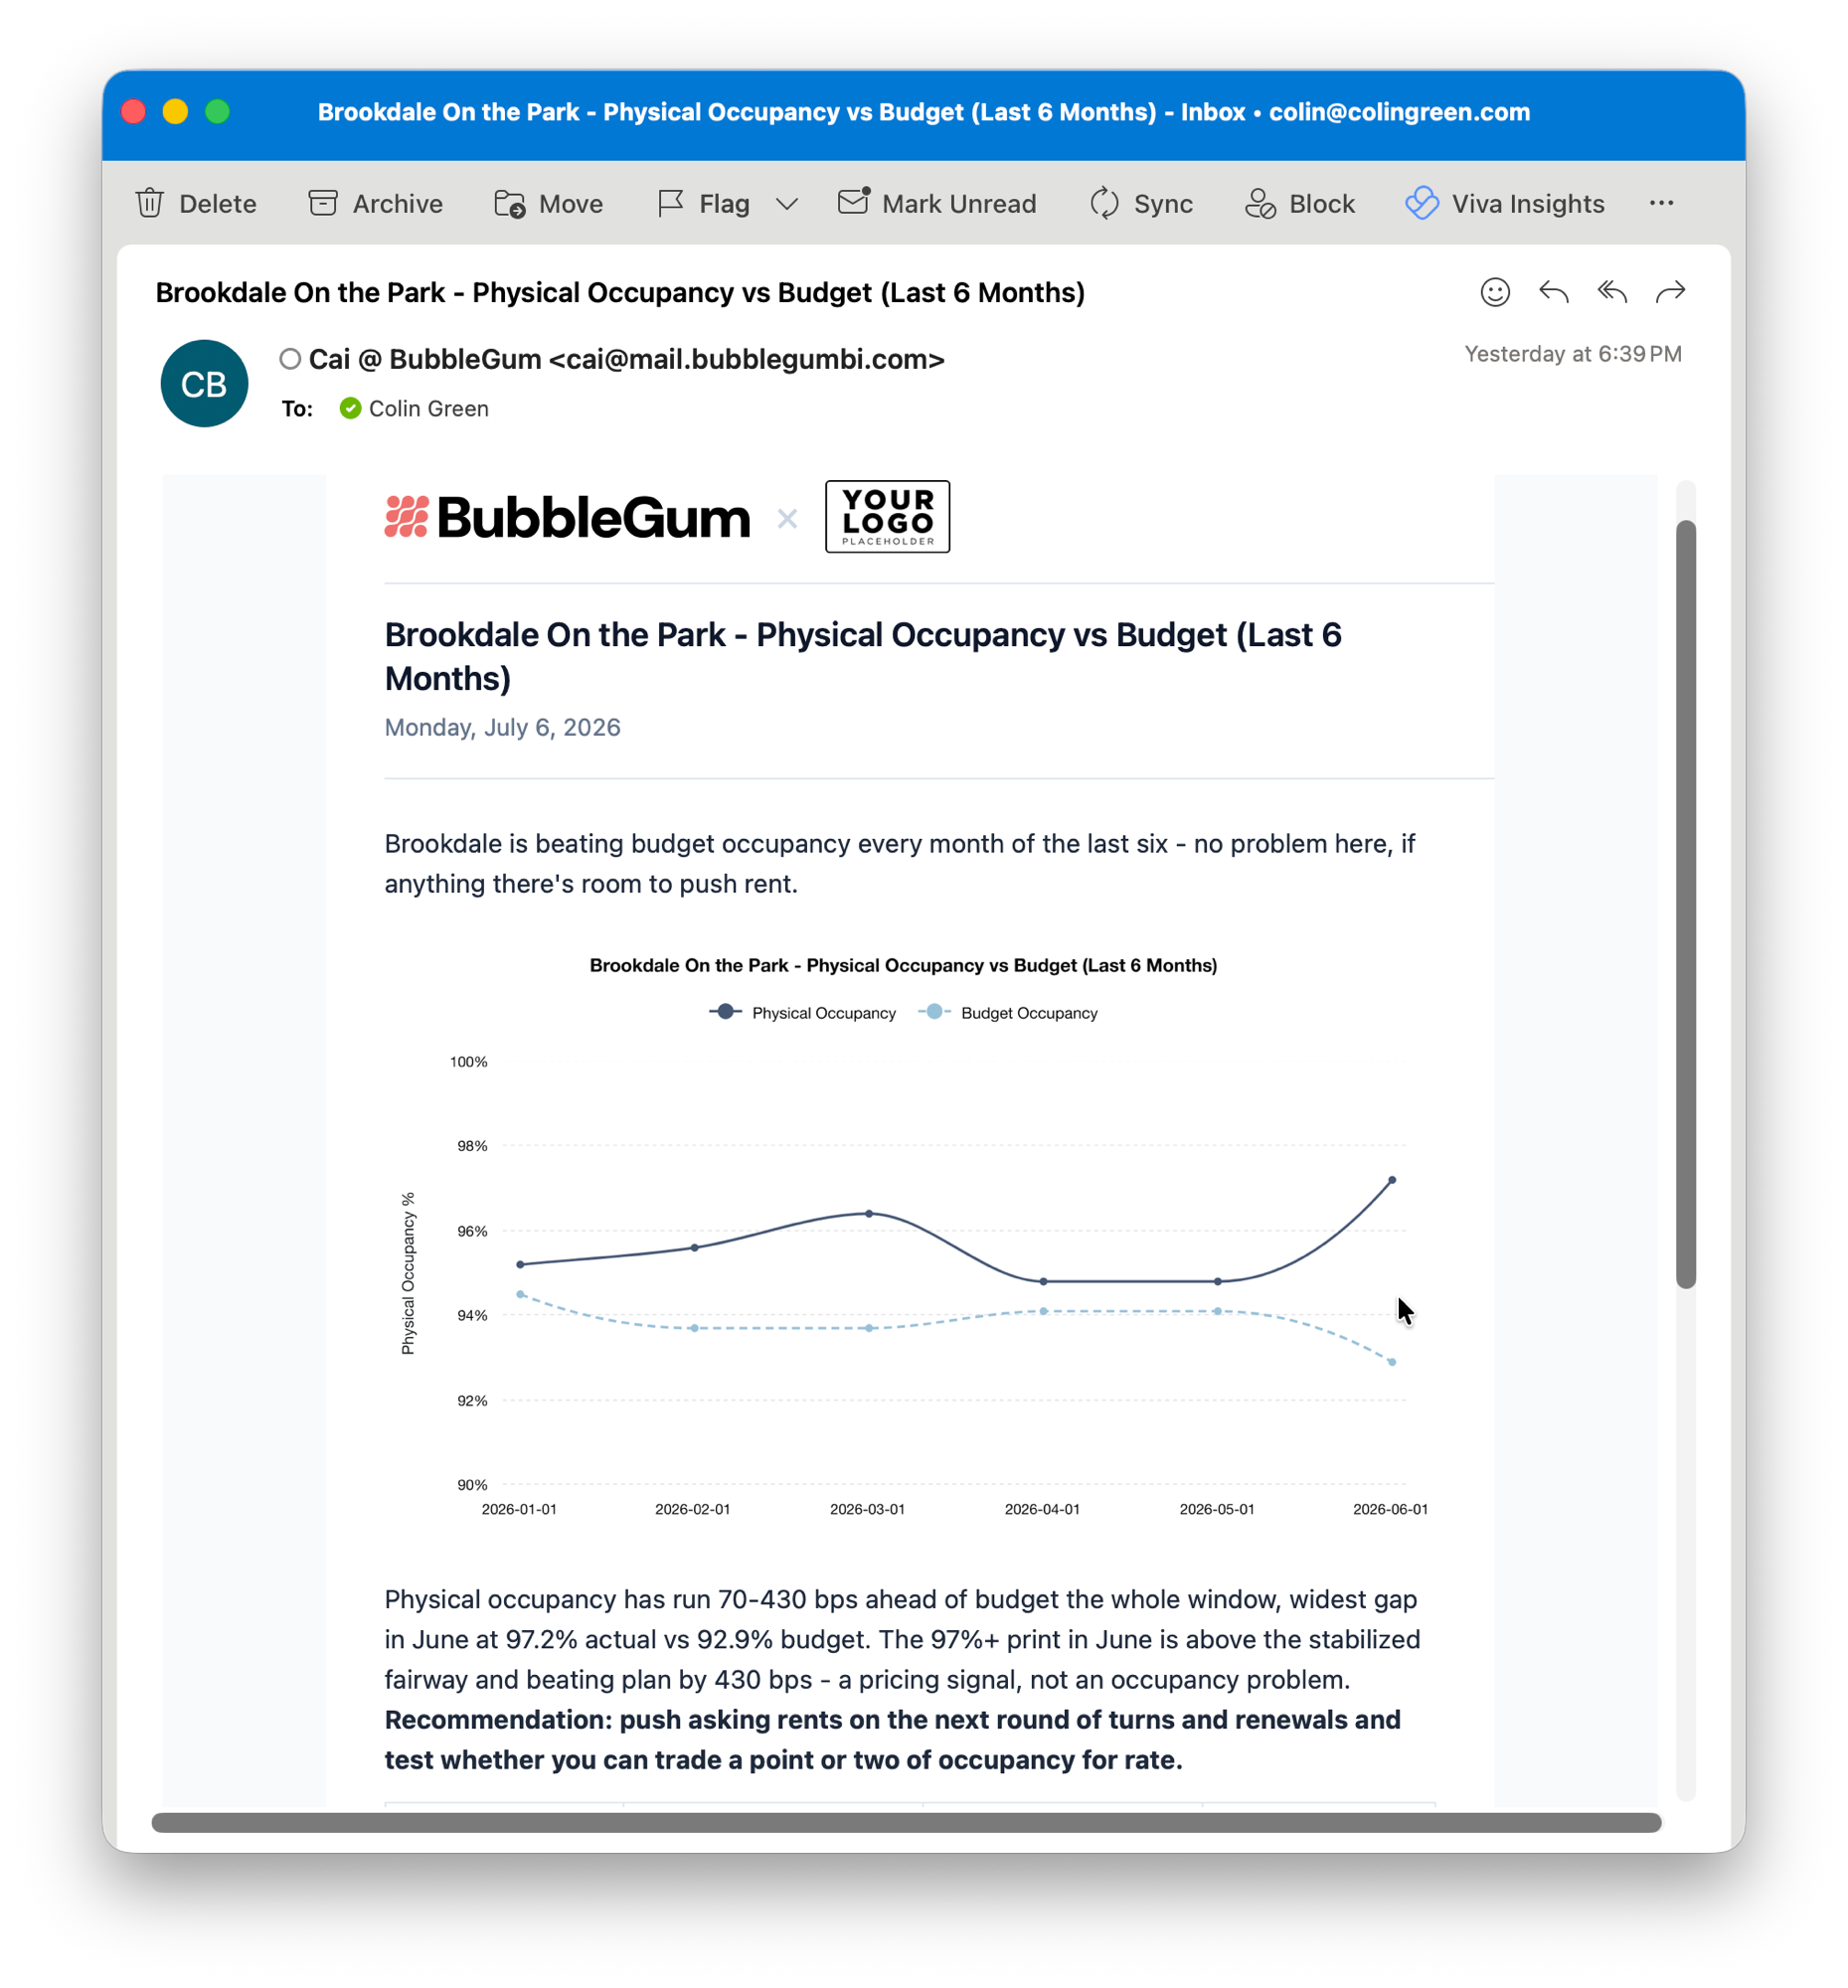
The reports Cai emails you on a schedule now arrive with real, brand-colored charts, not just tables and numbers.
- The chart types you'd expect. Trend lines with a budget comparison, stacked bars, donuts, and combo charts with dual axes.
- Placed where they read best. Cai puts each chart inline in the email or inside the attached PDF.
Share Any Chat, or Export a Branded PDF
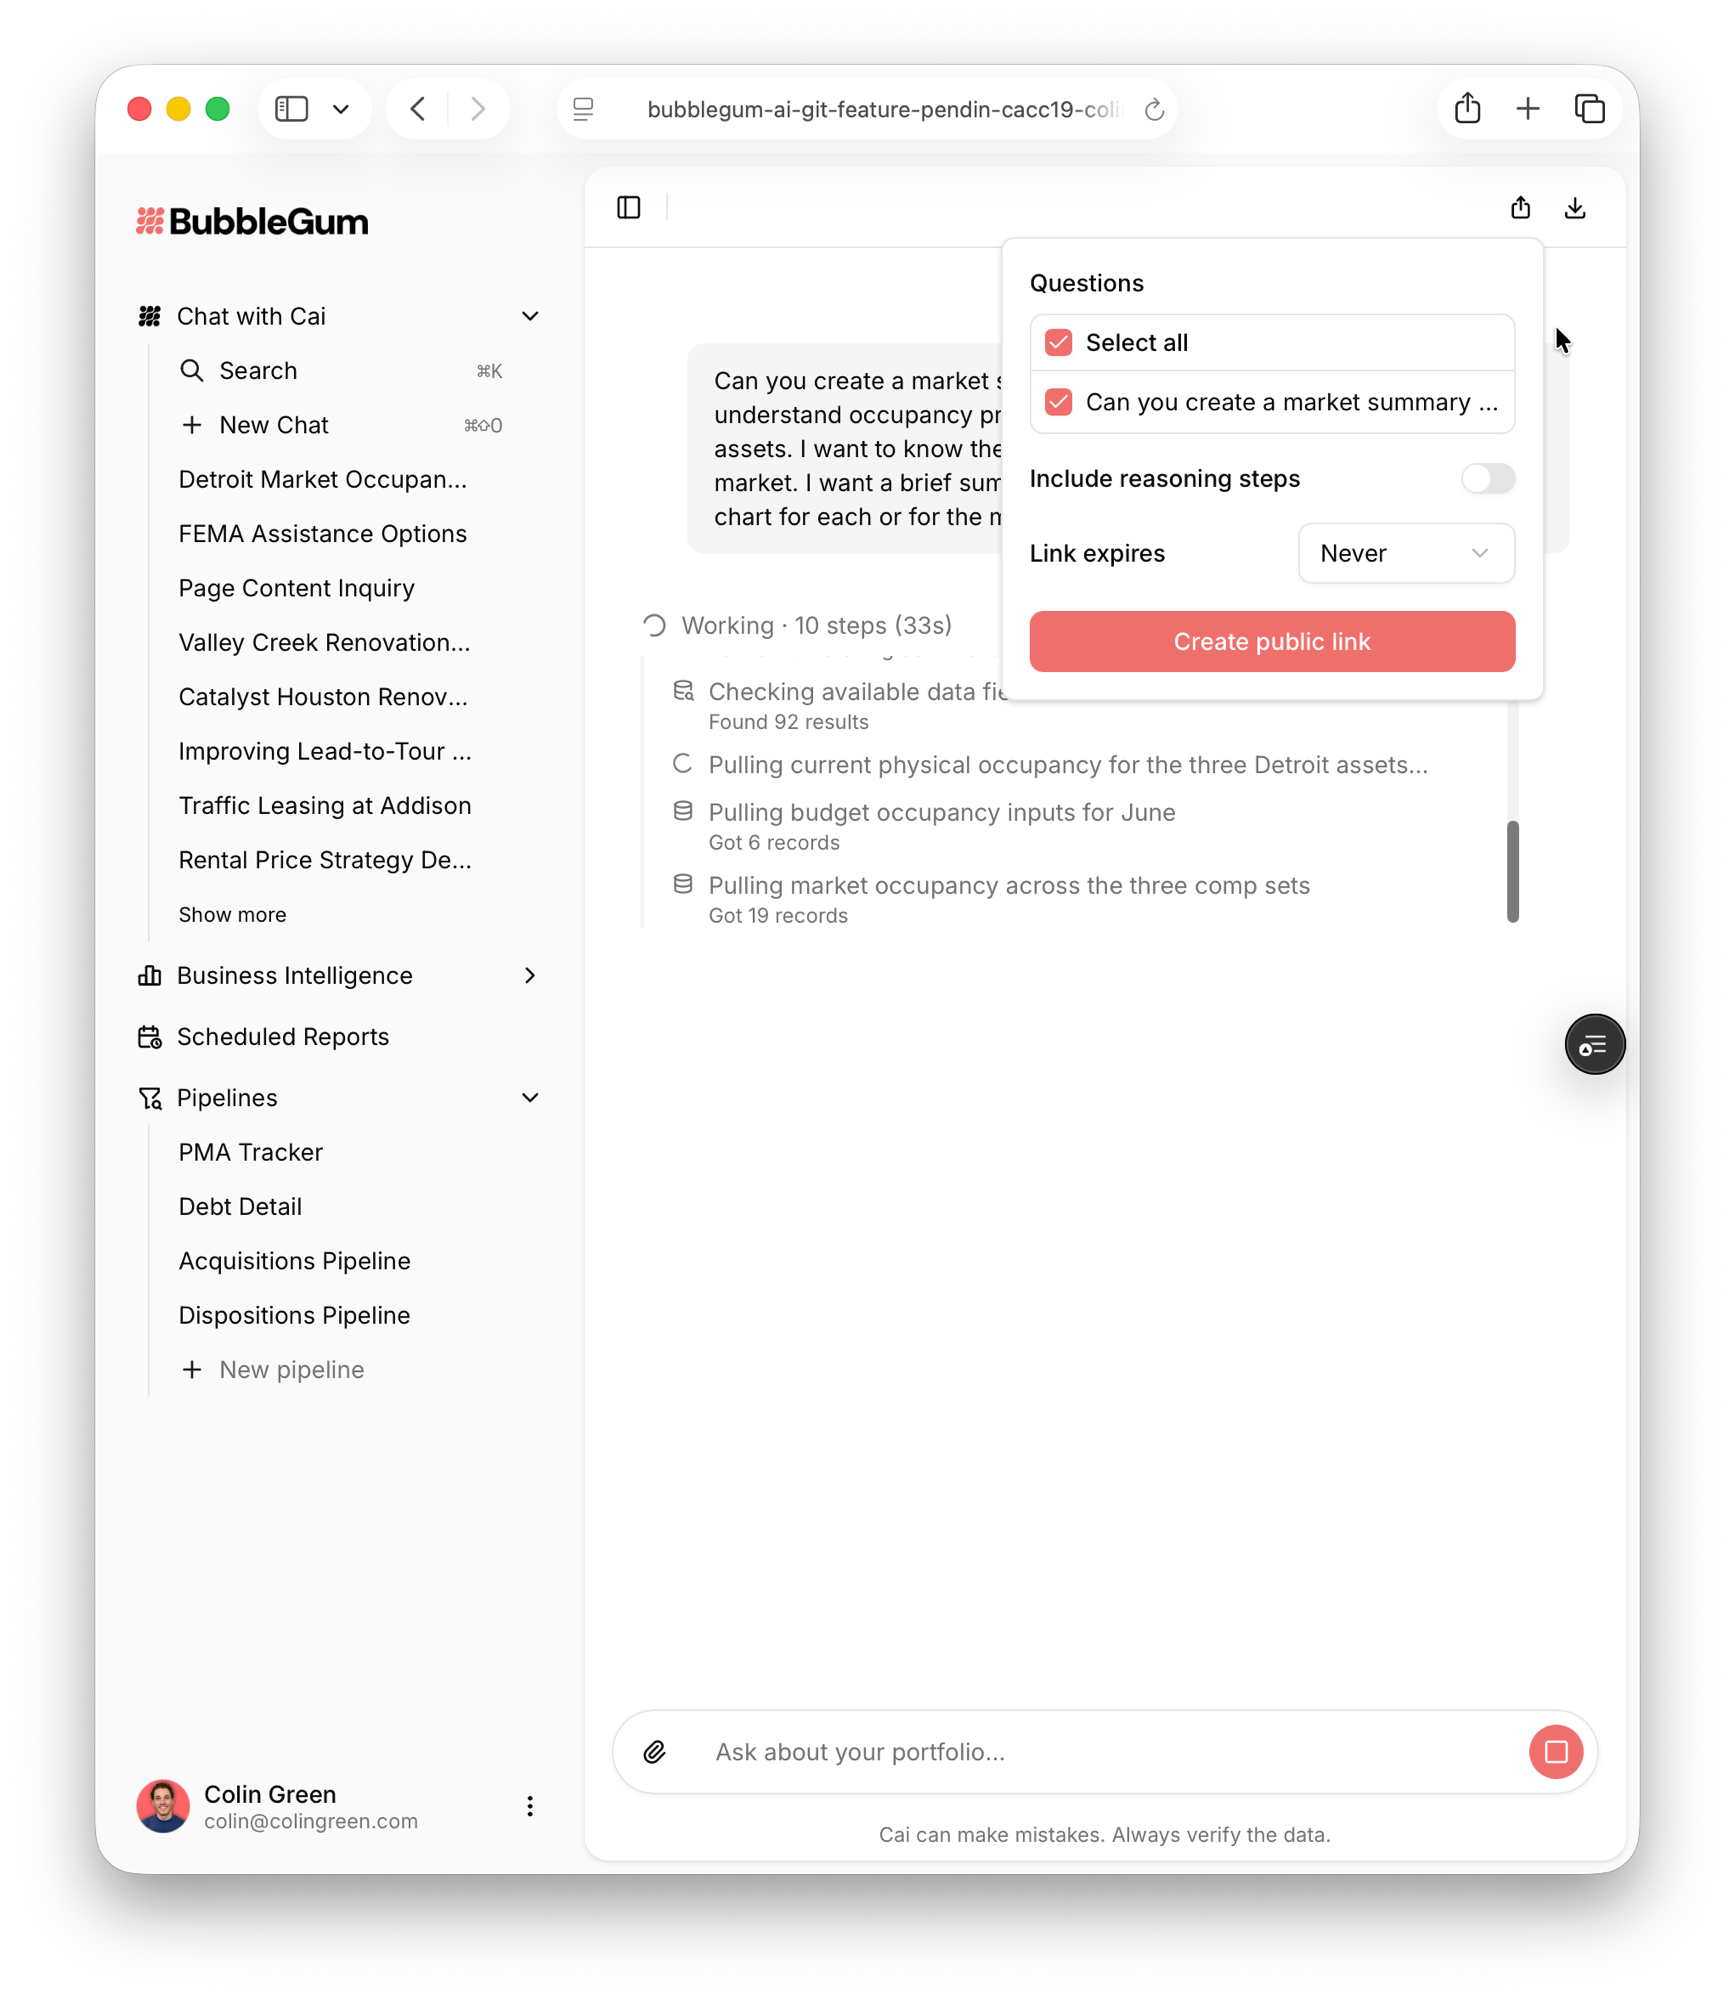
Two new buttons on every conversation: Share and Export.
- A link anyone can open. Share a read-only link to the chat, no BubbleGum account required, so you can hand an analysis to an owner, investor, or colleague outside the platform.
- You control what goes out. Pick which questions to include, choose whether to show Cai's reasoning, set an expiration, and revoke a link or check its view count any time.
- A co-branded PDF. Export the same conversation as a polished PDF, charts and tables and all, ready for an owner update or a leave-behind.
- Branded and safe. Shared pages and PDFs carry your branding, and raw data downloads stay locked to logged-in users, so nothing sensitive rides out on an anonymous link.
Your Logo on Your BubbleGum BI Dashboards
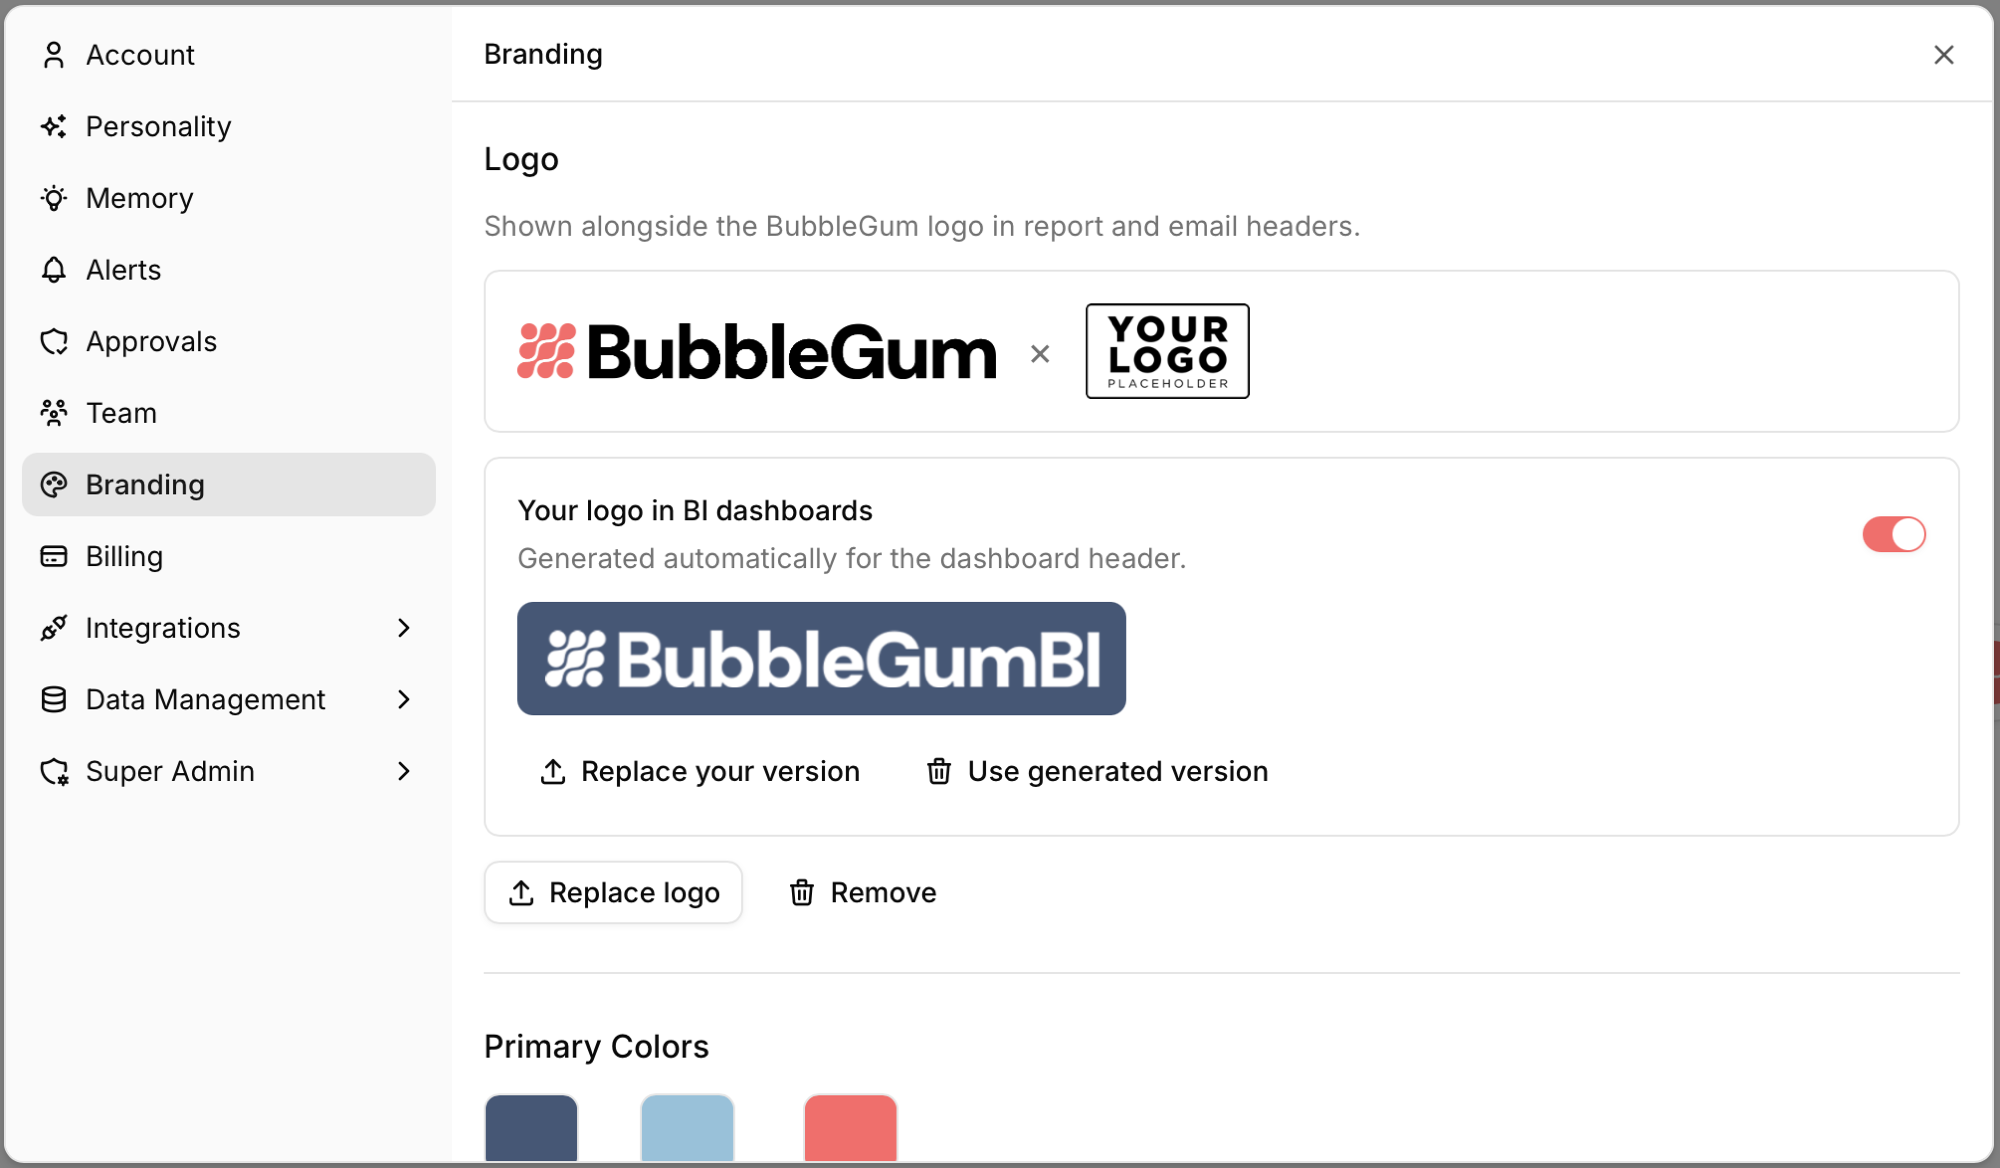
Upload your logo once and BubbleGum puts it on your dashboards, right alongside your reports and emails.
- Dashboard-ready automatically. BubbleGum derives a clean, correctly sized version of your logo for the dashboard header, so it looks right with no prep on your end.
- Yours to control. Preview it on your header color, toggle it on or off, or upload your own version to use instead. Set it under Settings, then Branding.
New Market Data: Census and FEMA
BubbleGum Research, the public data Cai pulls alongside your own numbers, adds two sources this month. Ask about a market and Cai can now fold in live Census figures (income, rents, rent burden, renter share, demographics, and the new-supply pipeline) from a single neighborhood up to a whole metro, plus FEMA hazard data (flood zones, county risk profiles, disaster history, and real flood-insurance claims) for any US address. The context behind a market's insurance line, right next to the property and rate data Cai already reads. Ask Cai about a market →


Send Feedback Straight to Our Team
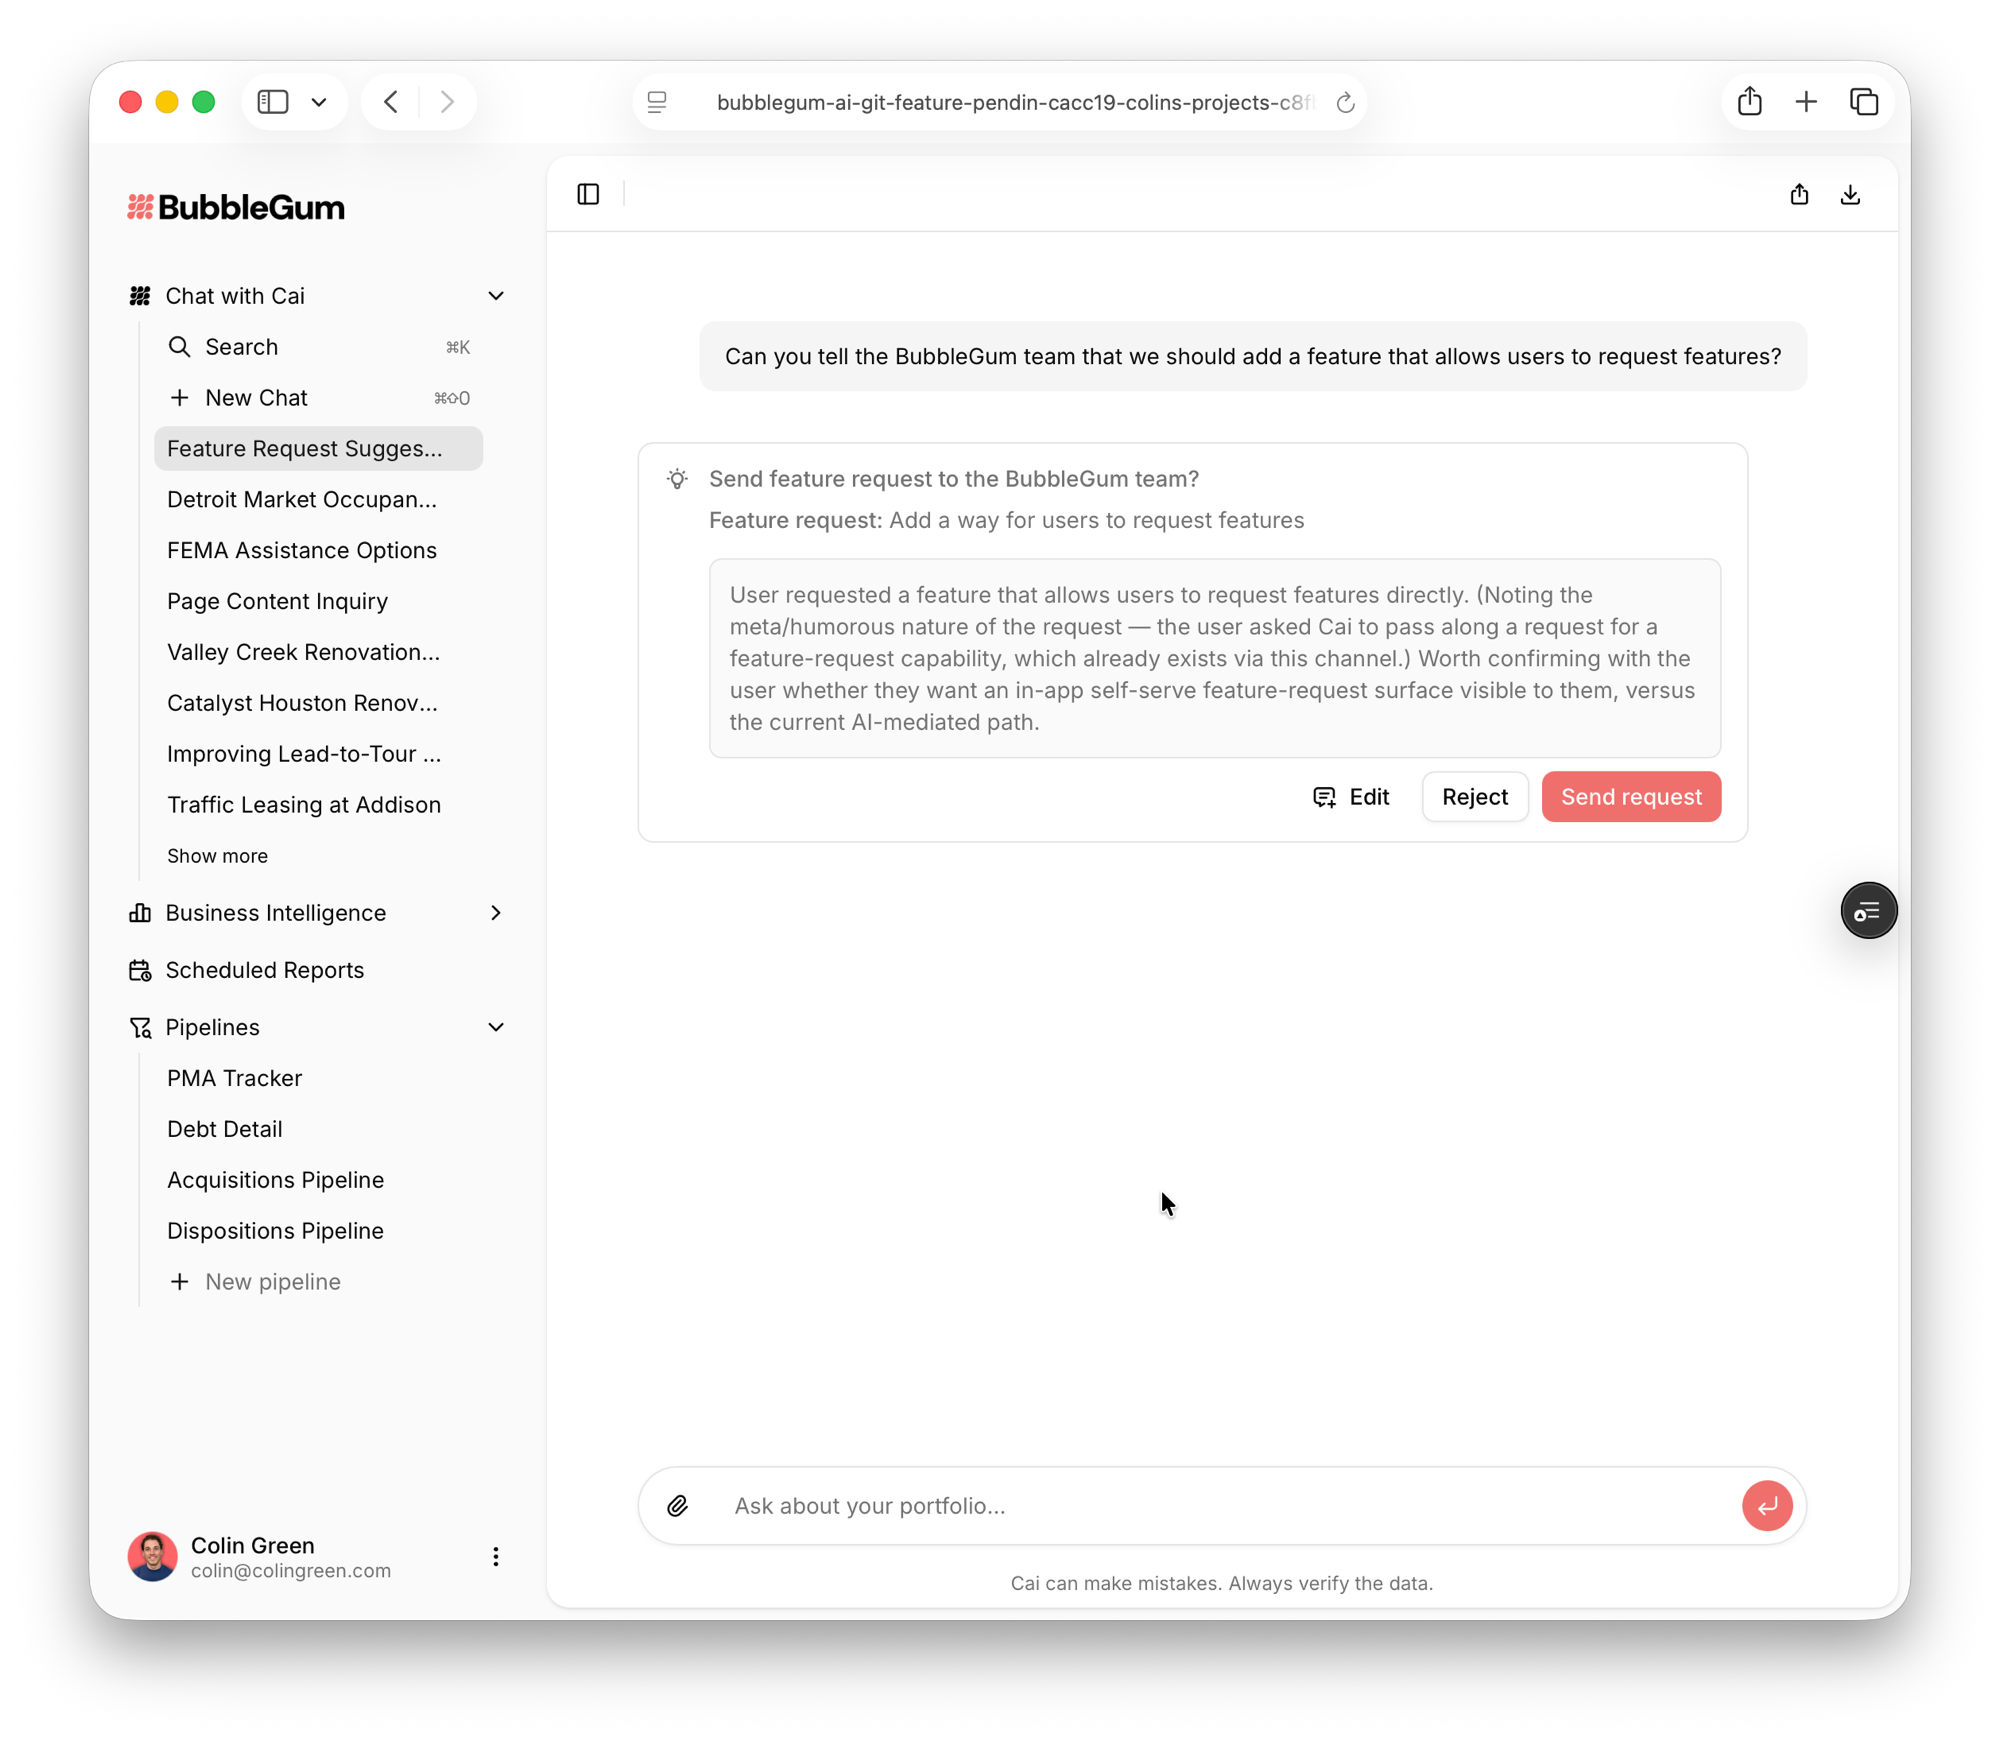
Cai has always offered to pass your requests and feedback along, but until now it had no way to actually hand them off. Now it does. Tell Cai what you need or how something should work, and it files your note directly with the BubbleGum team, with the context of what you were working on. You approve what gets sent. Tell Cai what's missing →
Search and Reference Past Conversations
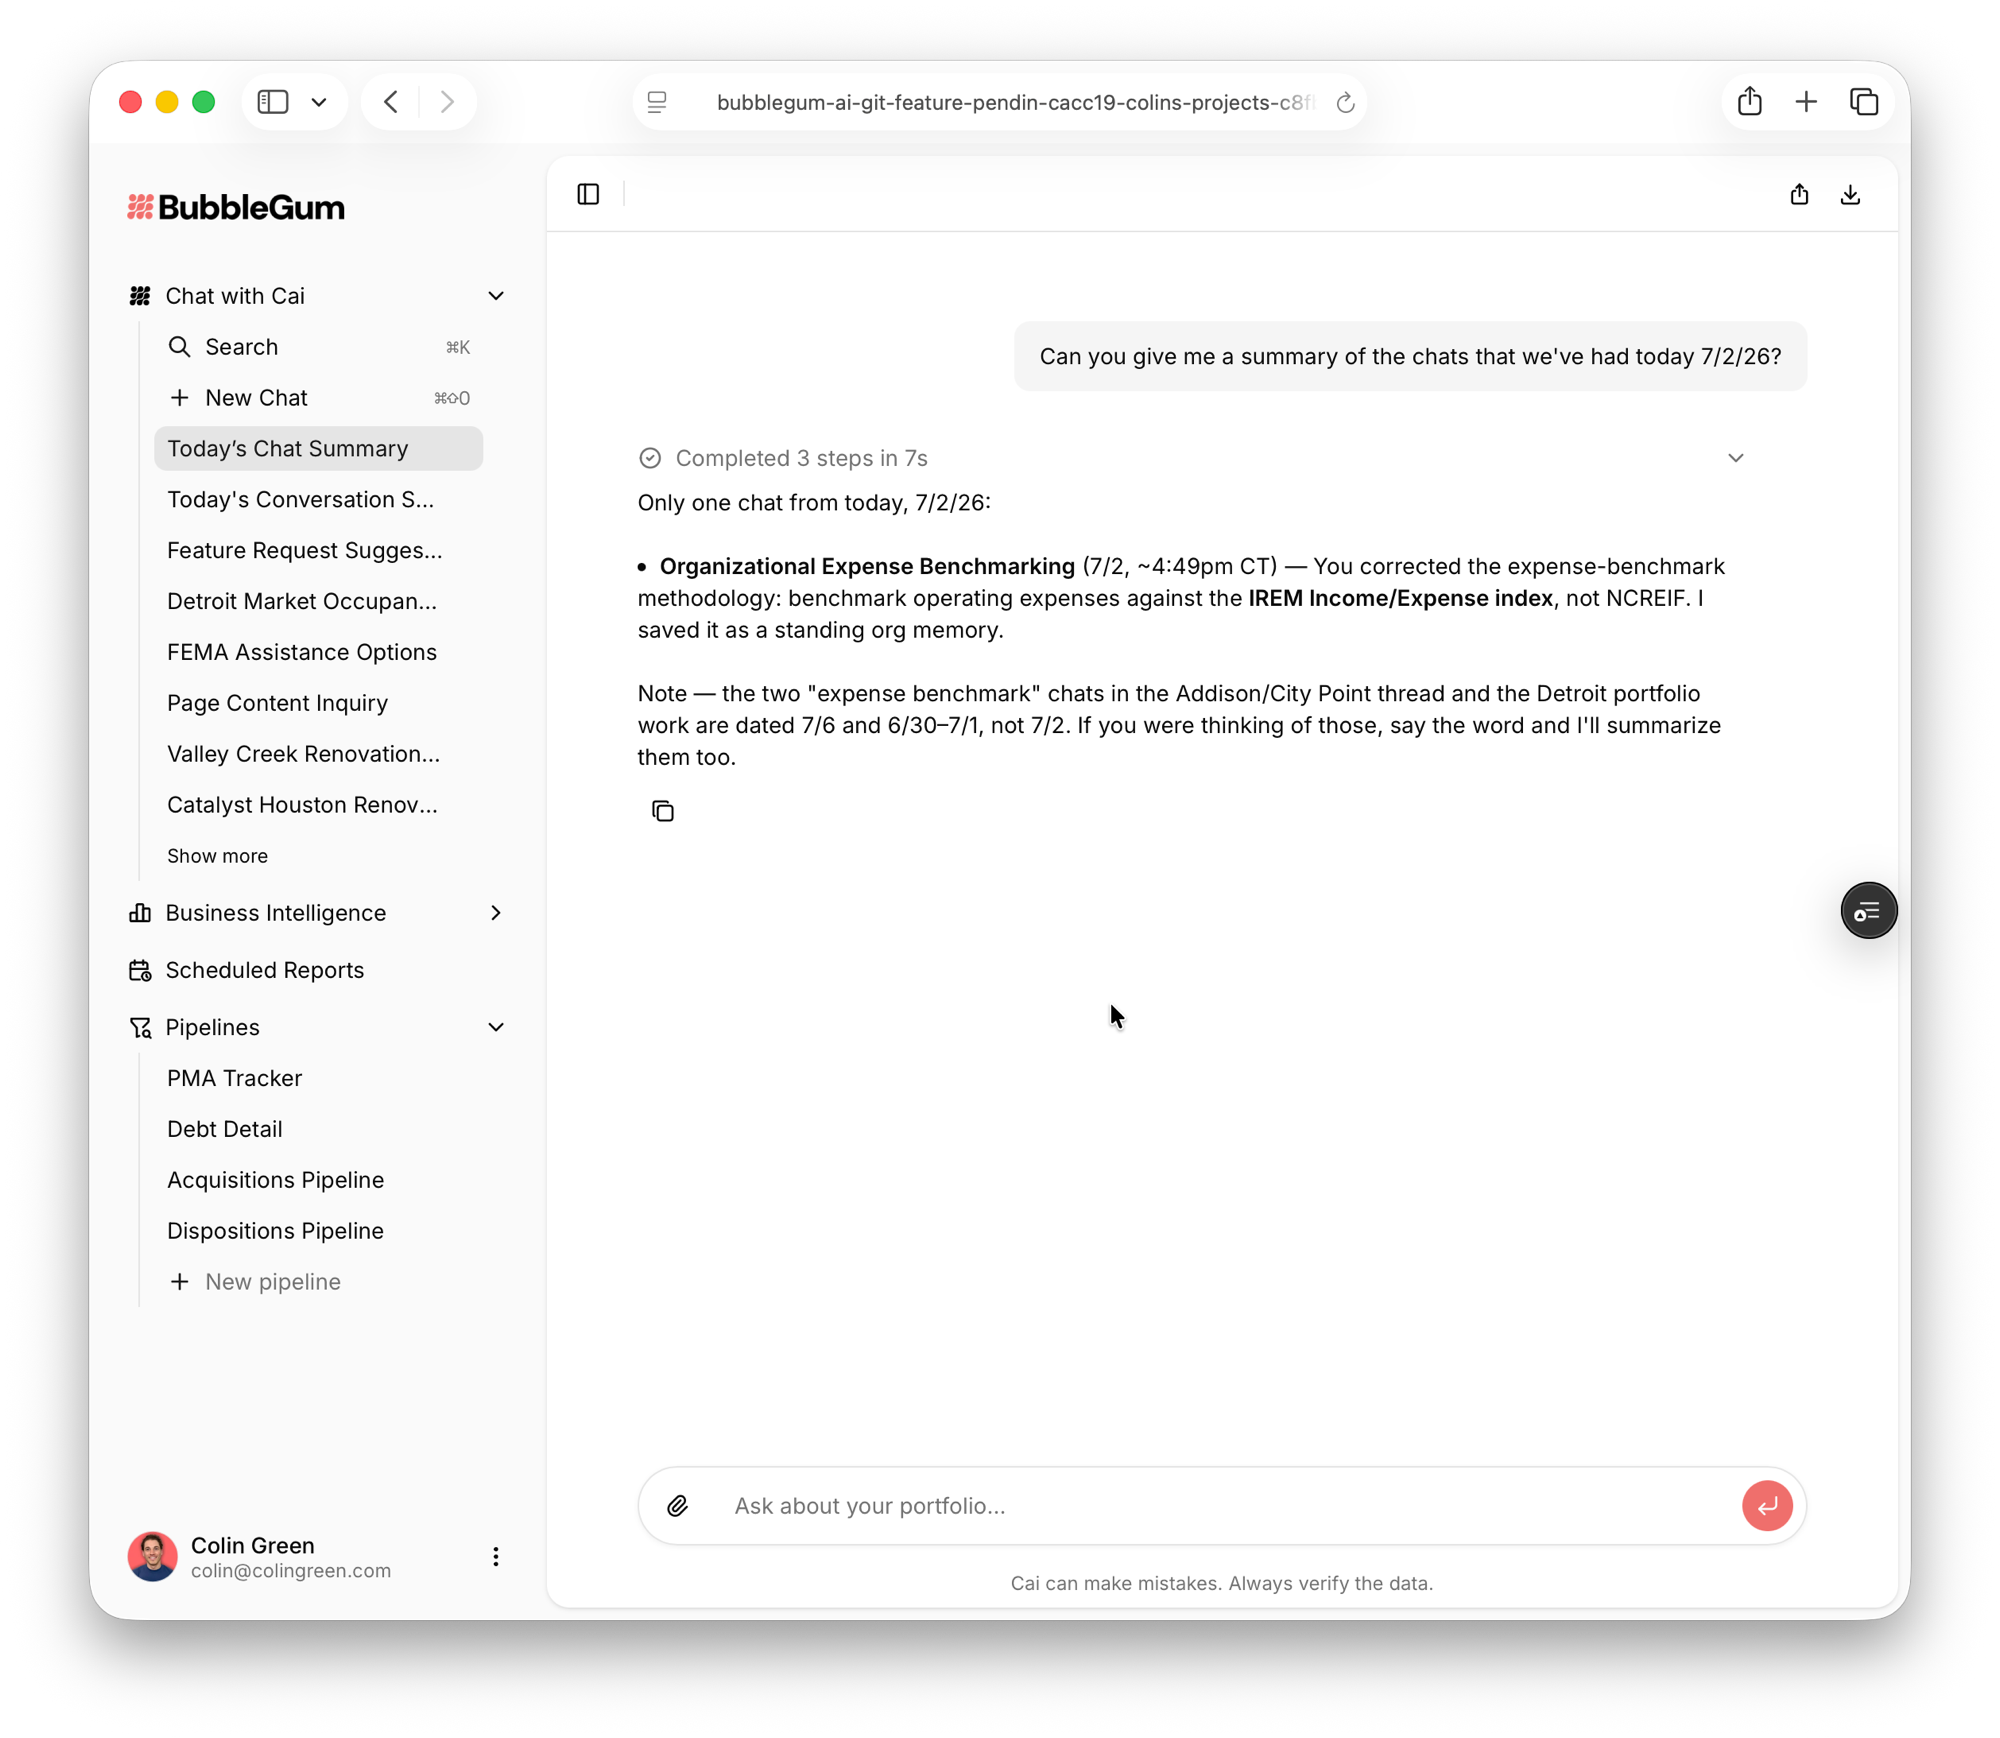
On top of the memories Cai already keeps, it can now search back through your earlier chats and pull the relevant one into the conversation. Ask "what did we land on for Marquette renewal pricing last month?" and Cai finds that discussion and builds on it. Your chats only. Try it in a chat →
Detail-Level Data: The Records Behind Any Number
Ask Cai about a headline metric and it can drop into the records underneath, the actual transactions and events that make it up.
- The leasing funnel, event by event. The raw CRM stream behind your traffic: every tour, call, and application, plus applicant screening.
- Leases and pricing, line by line. Individual leases with their full charge breakdowns, availability and pricing by lease term, and every renewal offer sent.
- The GL behind a P&L line. The individual general-ledger postings that make up any monthly revenue or expense category, so you see exactly what drove it. (Loaded for a subset of portfolios so far; Cai will tell you if yours isn't yet.)
Cai reaches for this on its own whenever a number needs explaining, and you can always ask for the records behind any figure. Ask Cai to go deeper →
Cai should also be sharper in a few areas this month
A handful of tweaks to how it reads your data, so it should lean the right way more often:
- Occupancy against budget. Cai has always had your budgets in hand, but we found it wasn't great at proactively leaning on them. It should now, occupancy especially: "93.2% occupied, 1.1 points under the 94.3% July budget."
- Demand before price. Facing soft occupancy, Cai should now read the leasing funnel before it looks at rent, so it can tell an under-toured property from an overpriced one.
- Concessions in a soft market. Cai should now raise the competitive concession dynamic on its own, along with the levers to match it without giving up effective rent.
- Reading a renewal. Cai should now recognize the messy states in renewal data, early move-outs, held offers, month-to-month lapses, and transfers, before it flags anything.
- Why an expense runs hot. When it benchmarks expenses, Cai should now name the dollar drivers behind the variance, not just the number.
- Reading the dashboard you're on. Cai should now read the BubbleGum BI dashboard in front of you, the visuals and the measures behind them, and explain why a number on screen looks the way it does.
- More attachments, handled better. You can now include more files in a single message, with general improvements to the attachment experience.
We're always working to deepen what Cai understands. If you ever spot an area worth a closer look, you can now tell Cai directly (see above) and we'll dig in.
Want to help shape what's next?
Several of these are being built with clients in the room. If one is your workflow, let's build it together.
Collaborate with usSee July's release on your portfolio
Cai in Excel, Pipelines, prep briefings, shareable analysis, and more.
Schedule a Demo