
Market-Wide Cancel & Denial Rates
We're introducing two critical metrics that reveal what's really happening in your competitive market: application cancel/denial rates and average days on market. These are the leasing velocity indicators that separate properties winning the leasing battle from those quietly bleeding prospects—and now you can track both across your entire competitive set.
Why it matters: Every asset manager knows the pain of cancels and denials. You're spending thousands on marketing to drive tours and applications, only to watch prospects fall off before lease execution. But here's the question that keeps you up at night: Is this a me problem or a market problem? When waves of cancellations crash over your portfolio, it's impossible to know if you're underperforming or if the entire market is struggling. Now you can leverage market survey intelligence to see exactly where you stand relative to your comps—and whether your conversion issues are operational friction or broader market dynamics.
Application Cancel/Denial Rates Across Your Market
Track cancel/denial rates for your properties and competitive comps. We calculate this as cancellations and denials divided by total applications, capturing unit offline periods between 3 and 45 days to identify real leasing friction that impacts your conversion funnel.
If your cancel/denial rate is elevated relative to comps, you know it's time to examine screening criteria, pricing strategy, or operational execution. If the entire market is experiencing high rates, you can adjust expectations and focus efforts where they'll actually move the needle.
Average Days on Market
See exactly how long it takes to lease units across your competitive set. We measure from the first time a unit appears on a property website to lease execution—giving you true absorption velocity, not PMS-reported days vacant.
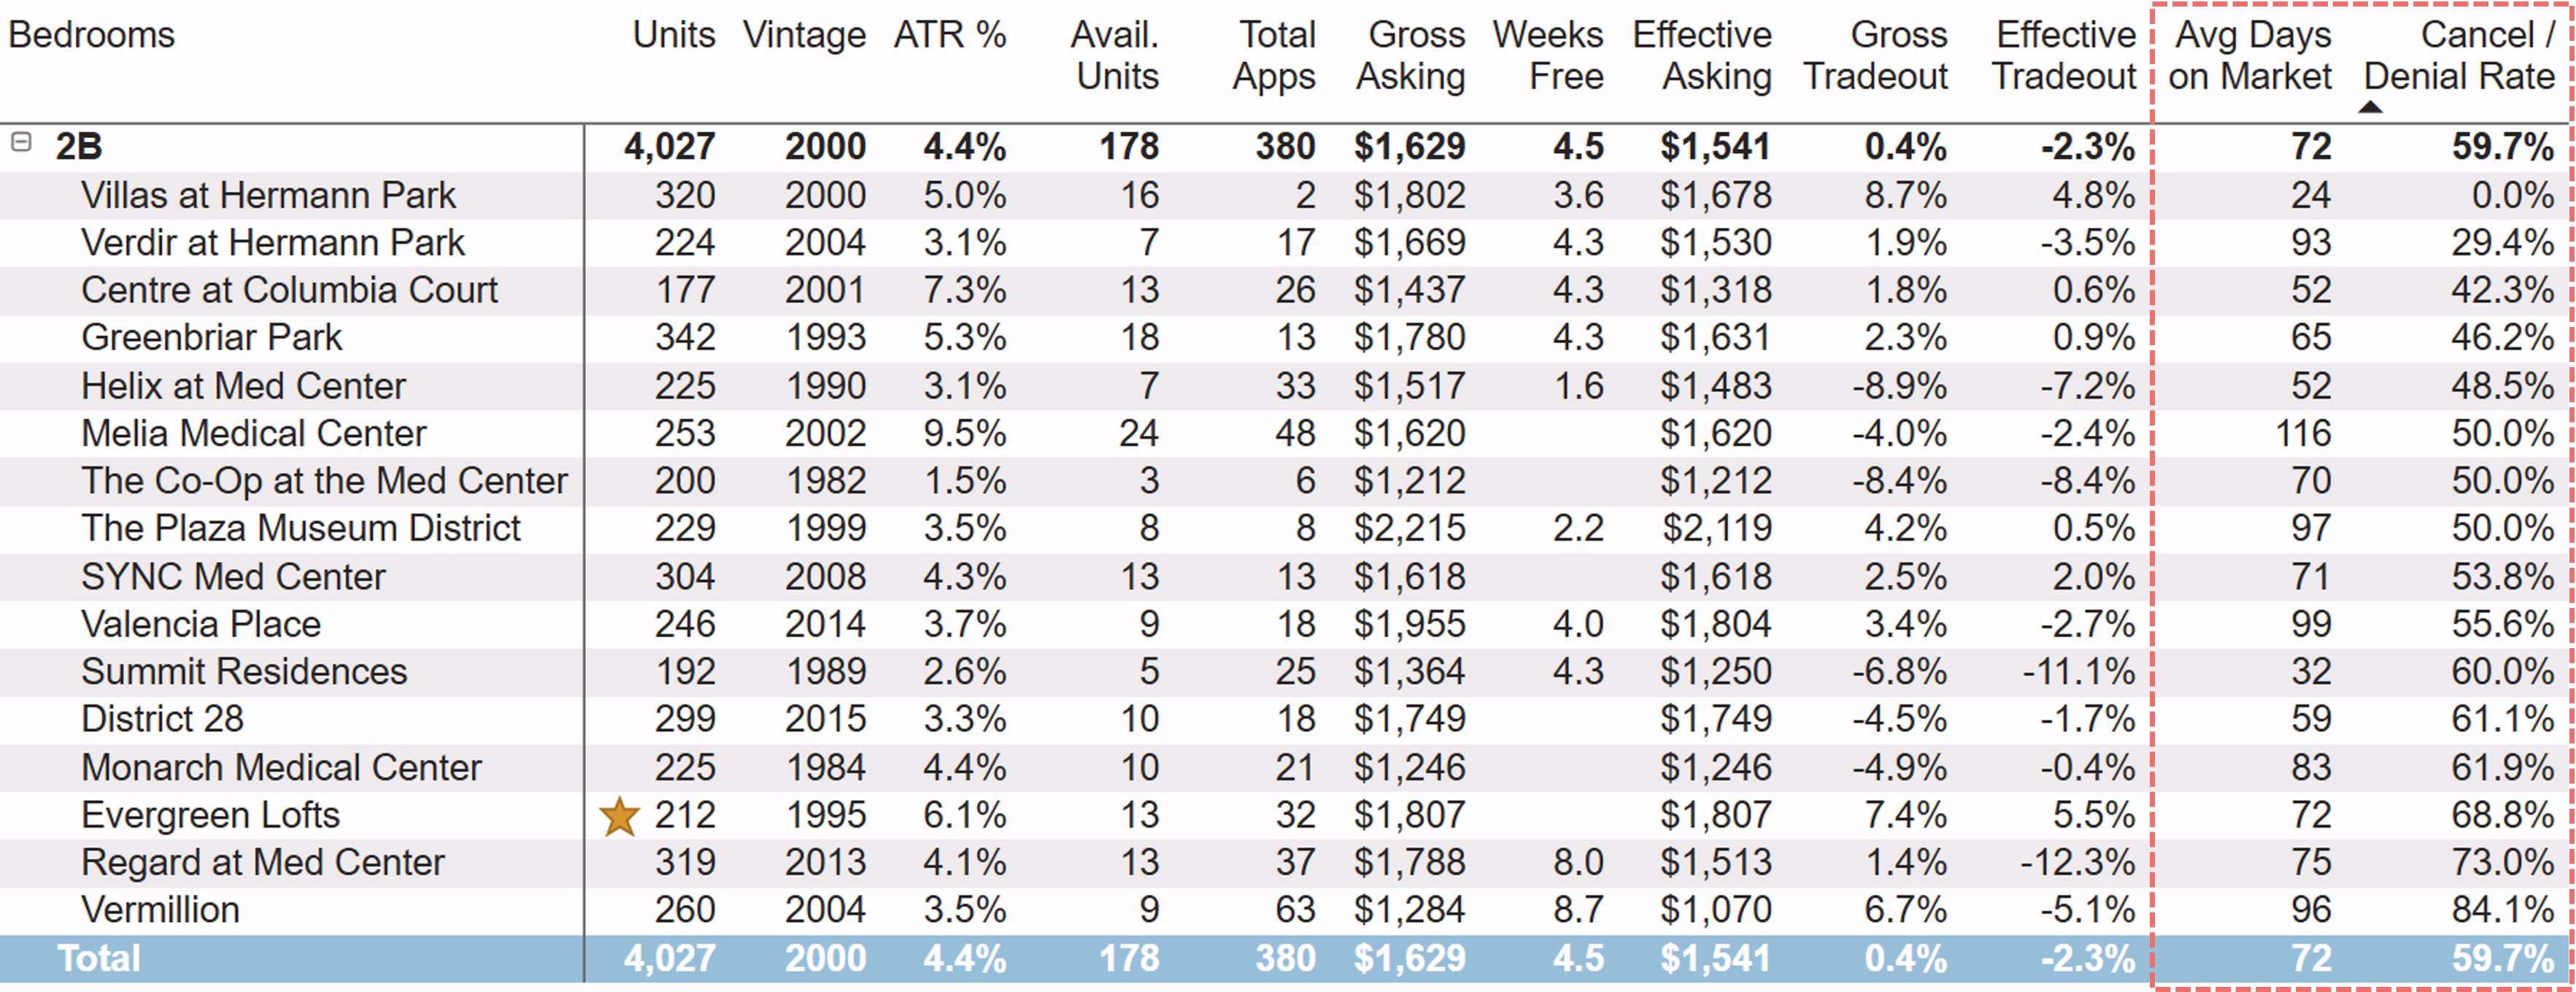
Strategic Intelligence: If your comps are leasing units in 65 days and you're averaging 80, the market is signaling something. Either pricing is too aggressive, marketing isn't driving qualified traffic, or operational execution is lagging. Days on market gives you an early warning system before occupancy starts to deteriorate.
Plus: Major Performance Improvement
Candidly, we used the market survey tools every day just like you do—and they were too slow. The team has spent significant time optimizing the entire market intelligence engine. The result? 88% faster load times across all market dashboards. We're not perfect yet, but this is a substantial improvement that makes daily workflows far more efficient.
See Where Your Market Stands
Explore the new Market-Wide Cancel & Denial Rates and uncover competitive insights you've been missing.
Show Me My Portfolio